
WW International Inc. (WW): Price and Financial Metrics
WW Price/Volume Stats
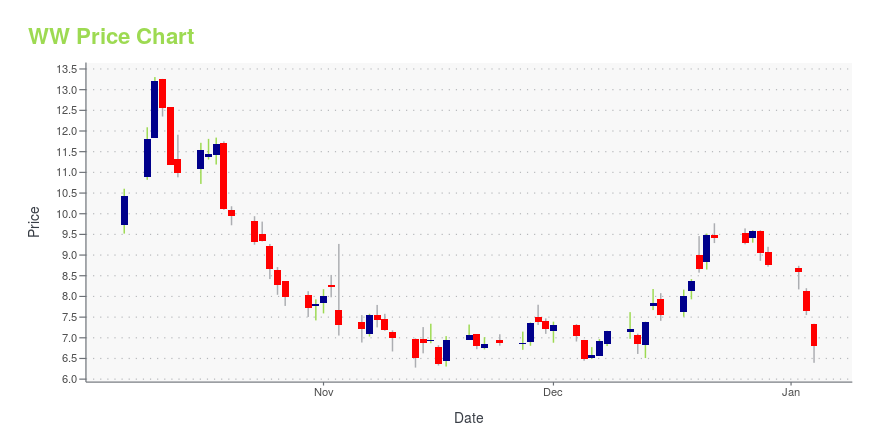
| Current price | $1.16 | 52-week high | $13.31 |
| Prev. close | $1.32 | 52-week low | $1.09 |
| Day low | $1.14 | Volume | 3,793,900 |
| Day high | $1.29 | Avg. volume | 4,610,716 |
| 50-day MA | $1.40 | Dividend yield | N/A |
| 200-day MA | $4.21 | Market Cap | 91.56M |
WW Stock Price Chart Interactive Chart >
WW International Inc. (WW) Company Bio
WW (formerly Weight Watchers) provides weight management services through a range of products and services comprising nutritional, exercise, and behavioral tools and approaches. The company was founded in 1961 and is based in New York, New York.
Latest WW News From Around the Web
Below are the latest news stories about WW INTERNATIONAL INC that investors may wish to consider to help them evaluate WW as an investment opportunity.
WeightWatchers launches program for weight-loss drug users after Oprah confirms GLP-1 useOn Monday, the 60-year-old weight-loss company, formally known as WW International, announced the launch of the WeightWatchers GLP-1 Program. |
WW International now offering program with weight loss drugsWW International (WW) — formerly Weight Watchers — has launched a program for individuals using GLP-1 medications to lose weight, a topic that has taken news headlines by storm throughout 2023. This rollout comes at the same time WW board member Oprah Winfrey revealed she has been using this class of weight loss drugs, despite comments in recent months criticizing the trend. Yahoo Finance's Brooke DiPalma breaks down WW International's nutrition program incorporating popular weight loss drugs and how pharmaceutical stocks are responding. For more expert insight and the latest market action, click here to watch this full episode of Yahoo Finance Live. |
WeightWatchers Launches New Behavior Change Program Designed to Support the Unique Needs of Individuals on GLP-1 MedicationsFirst-ever nutrition and activity program to complement a GLP-1 weight loss journey for those who receive medication through the new WeightWatchers Clinic or their medical provider WeightWatchers GLP-1, Clinic and Weight Health Programs WeightWatchers GLP-1 Program App Image, WeightWatchers Clinic App Image, WeightWatchers Programs Image NEW YORK, Dec. 14, 2023 (GLOBE NEWSWIRE) -- WeightWatchers (NASDAQ: WW), (“WeightWatchers,” “WW,” or the “Company”) announced today the launch of WeightWatchers |
WW International, Inc. (NASDAQ:WW) is favoured by institutional owners who hold 73% of the companyKey Insights Significantly high institutional ownership implies WW International's stock price is sensitive to their... |
WW International, Inc. Announces Participation in Upcoming Investor ConferencesNEW YORK, Nov. 13, 2023 (GLOBE NEWSWIRE) -- WW International, Inc. (NASDAQ: WW) (“WeightWatchers,” “WW,” or the “Company”) today announced that it will present at the following investor conferences. Jefferies London Healthcare ConferenceThursday, November 16, 2023 at 8:30 am GMT (London) London, United KingdomPresenters: Sima Sistani, Chief Executive Officer and Heather Stark, Chief Financial Officer BofA Securities Leveraged Finance Conference 2023Tuesday, November 28, 2023 at 4:10 pm ETBoca Ra |
WW Price Returns
| 1-mo | -4.92% |
| 3-mo | -33.71% |
| 6-mo | -73.39% |
| 1-year | -89.05% |
| 3-year | -96.23% |
| 5-year | -94.75% |
| YTD | -86.74% |
| 2023 | 126.68% |
| 2022 | -76.07% |
| 2021 | -33.89% |
| 2020 | -36.14% |
| 2019 | -0.88% |
Loading social stream, please wait...