
Xcel Brands, Inc (XELB): Price and Financial Metrics
XELB Price/Volume Stats
| Current price | $0.70 | 52-week high | $2.10 |
| Prev. close | $0.72 | 52-week low | $0.58 |
| Day low | $0.69 | Volume | 7,500 |
| Day high | $0.75 | Avg. volume | 41,363 |
| 50-day MA | $0.68 | Dividend yield | N/A |
| 200-day MA | $0.93 | Market Cap | 16.44M |
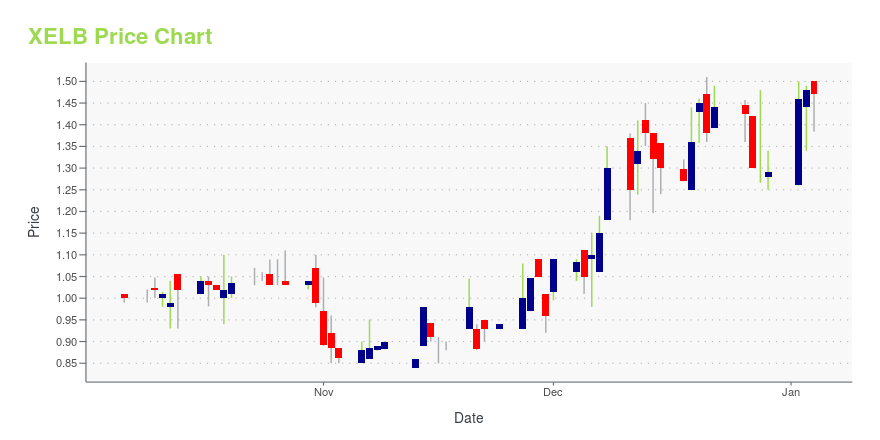
XELB Stock Price Chart Interactive Chart >
Xcel Brands, Inc (XELB) Company Bio
Xcel Brands, Inc. operates as a brand management and development company in the United States. It engages in the design, licensing, and marketing of branded apparel, footwear, accessories, and home goods; and acquisition of high profile consumer lifestyle brands, including the Isaac Mizrahi brand, the Judith Ripka brand, and certain rights of the Liz Claiborne New York brand, as well as H by Halston and H Halston brands. The company is based in New York City, New York.
Latest XELB News From Around the Web
Below are the latest news stories about XCEL BRANDS INC that investors may wish to consider to help them evaluate XELB as an investment opportunity.
Sidoti Events, LLC's Virtual December Small-Cap ConferenceNEW YORK, NY / ACCESSWIRE / December 5, 2023 / Sidoti Events, LLC, an affiliate of Sidoti & Company, LLC, has released the presentation schedule and weblinks for its two-day December Small-Cap Conference taking place Wednesday and Thursday, December ... |
CORRECTION – Xcel Brands, Inc. and Fashion Icon Christie Brinkley form Joint VentureTWRHLL by Christie Brinkley to launch in Spring 2024 Christie Brinkley Christie Brinkley NEW YORK, Dec. 04, 2023 (GLOBE NEWSWIRE) -- In a release issued under the same headline earlier today by Xcel Brands, Inc. (Nasdaq: XELB), please note that in the third sentence of the second paragraph, the word, "confidentially," should be, "confidently." The corrected release follows: Xcel Brands, Inc. (NASDAQ: XELB) ("Xcel" or the "Company"), a media and consumer products company with expertise in livestr |
Xcel Brands, Inc. and Fashion Icon Christie Brinkley form Joint VentureTWRHLL by Christie Brinkley to launch in Spring 2024 Christie Brinkley Christie Brinkley NEW YORK, Dec. 04, 2023 (GLOBE NEWSWIRE) -- Xcel Brands, Inc. (NASDAQ: XELB) (“Xcel” or the “Company”), a media and consumer products company with expertise in livestream shopping and social commerce, announced today of its newly formed joint venture with supermodel, actress and entrepreneur, Christie Brinkley to develop TWRHLL, a lifestyle and apparel brand, for distribution in retail and livestream channel |
Xcel Brands, Inc. to Present at Upcoming Investor ConferencesNEW YORK, Dec. 01, 2023 (GLOBE NEWSWIRE) -- Xcel Brands, Inc. (NASDAQ: XELB) (“Xcel” or the “Company”), a media and consumer products company with significant expertise in livestream shopping and social commerce, today announced that it is scheduled to present at the following investor conferences: Noble Capital Markets 19th Annual Emerging Growth Equity Conference Location: Boca Raton, FLDate: December 4 – 5, 2023Presentation Time: December 5 at 3:00 pm ETWebcast: www.nobleconference.com Sidoti |
Xcel Brands, Inc. (NASDAQ:XELB) Q3 2023 Earnings Call TranscriptXcel Brands, Inc. (NASDAQ:XELB) Q3 2023 Earnings Call Transcript November 20, 2023 Xcel Brands, Inc. misses on earnings expectations. Reported EPS is $-0.15 EPS, expectations were $-0.14. Operator: Please be advised that reproduction of this call in whole or in part is not permitted without prior written authorization of Xcel Brands. And as a reminder, […] |
XELB Price Returns
| 1-mo | 13.36% |
| 3-mo | 2.07% |
| 6-mo | -46.15% |
| 1-year | -60.23% |
| 3-year | -68.75% |
| 5-year | -67.74% |
| YTD | -45.74% |
| 2023 | 84.23% |
| 2022 | -35.76% |
| 2021 | -9.92% |
| 2020 | -19.33% |
| 2019 | 32.74% |
Continue Researching XELB
Want to see what other sources are saying about XCel Brands Inc's financials and stock price? Try the links below:XCel Brands Inc (XELB) Stock Price | Nasdaq
XCel Brands Inc (XELB) Stock Quote, History and News - Yahoo Finance
XCel Brands Inc (XELB) Stock Price and Basic Information | MarketWatch
Loading social stream, please wait...