Xenia Hotels & Resorts, Inc. (XHR): Price and Financial Metrics
GET POWR RATINGS... FREE!
XHR POWR Grades
- XHR scores best on the Growth dimension, with a Growth rank ahead of 92.34% of US stocks.
- The strongest trend for XHR is in Sentiment, which has been heading down over the past 177 days.
- XHR's current lowest rank is in the Sentiment metric (where it is better than 15.14% of US stocks).
XHR Stock Summary
- Of note is the ratio of XENIA HOTELS & RESORTS INC's sales and general administrative expense to its total operating expenses; merely 5.79% of US stocks have a lower such ratio.
- Over the past twelve months, XHR has reported earnings growth of -607.84%, putting it ahead of only 2.93% of US stocks in our set.
- As for revenue growth, note that XHR's revenue has grown 92.12% over the past 12 months; that beats the revenue growth of 90.89% of US companies in our set.
- Stocks with similar financial metrics, market capitalization, and price volatility to XENIA HOTELS & RESORTS INC are CEQP, CTRE, KALU, VTR, and GAIA.
- XHR's SEC filings can be seen here. And to visit XENIA HOTELS & RESORTS INC's official web site, go to www.xeniareit.com.
XHR Valuation Summary
- XHR's price/sales ratio is 1.8; this is 62.5% lower than that of the median Real Estate stock.
- XHR's price/sales ratio has moved down 1.7 over the prior 97 months.
Below are key valuation metrics over time for XHR.
Stock | Date | P/S | P/B | P/E | EV/EBIT |
---|---|---|---|---|---|
XHR | 2023-01-20 | 1.8 | 1.1 | -723.9 | 33.1 |
XHR | 2023-01-19 | 1.7 | 1.1 | -697.9 | 32.4 |
XHR | 2023-01-18 | 1.7 | 1.1 | -688.9 | 32.1 |
XHR | 2023-01-17 | 1.7 | 1.1 | -696.4 | 32.3 |
XHR | 2023-01-13 | 1.7 | 1.1 | -683.9 | 32.0 |
XHR | 2023-01-12 | 1.7 | 1.1 | -694.9 | 32.3 |
XHR Growth Metrics
- Its 2 year net income to common stockholders growth rate is now at -3708.66%.
- Its year over year price growth rate is now at 0.64%.
- The 4 year price growth rate now stands at -57.31%.

The table below shows XHR's growth in key financial areas (numbers in millions of US dollars).
Date | Revenue | Operating Cash Flow | Net Income to Common Stock |
---|---|---|---|
2022-09-30 | 938.044 | 169.304 | -2.274 |
2022-06-30 | 870.16 | 134.576 | -22.804 |
2022-03-31 | 738.683 | 104.495 | -92.49 |
2021-12-31 | 616.188 | 40.763 | -143.517 |
2021-09-30 | 488.257 | -4.658 | -96.304 |
2021-06-30 | 379.427 | -24.729 | -126.455 |
XHR's Quality Factors
The “Quality” component of the POWR Ratings focuses on 31 different factors of a companies fundamentals and operational strength. Here are some key insights as we drill into the specifics of these quality attributes.- XHR has a Quality Grade of D, ranking ahead of 8.82% of graded US stocks.
- XHR's asset turnover comes in at 0.121 -- ranking 73rd of 79 Restaraunts Hotels Motels stocks.
- H, MGM, and PK are the stocks whose asset turnover ratios are most correlated with XHR.
The table below shows XHR's key quality metrics over time.
Period | Asset Turnover | Gross Margin | ROIC |
---|---|---|---|
2021-06-30 | 0.121 | 0.155 | -0.014 |
2021-03-31 | 0.076 | -0.064 | -0.029 |
2020-12-31 | 0.111 | 0.049 | -0.026 |
2020-09-30 | 0.171 | 0.178 | -0.030 |
2020-06-30 | 0.235 | 0.240 | -0.017 |
2020-03-31 | 0.327 | 0.302 | 0.010 |
XHR Price Target
For more insight on analysts targets of XHR, see our XHR price target page. And for a list of of all stocks sorted by upside potential based on analyst target price, see our Top Price Target page.
Average Price Target | $20.50 | Average Broker Recommendation | 1.67 (Moderate Buy) |
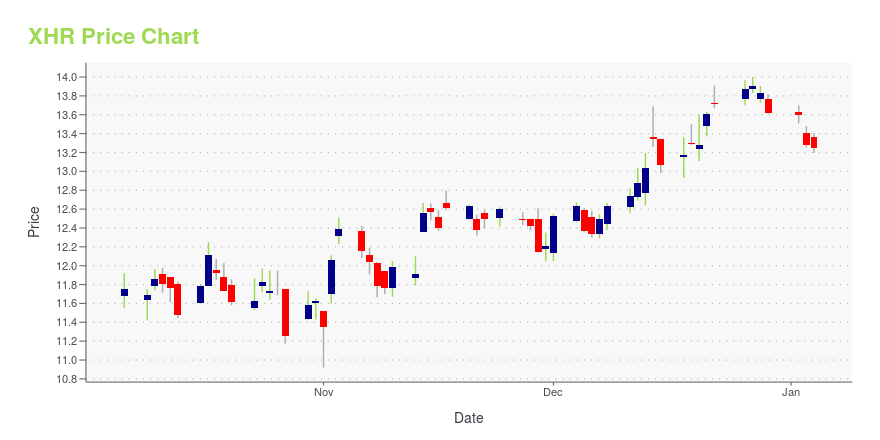
XHR Stock Price Chart Interactive Chart >
XHR Price/Volume Stats
Current price | $14.66 | 52-week high | $20.36 |
Prev. close | $14.77 | 52-week low | $12.48 |
Day low | $14.52 | Volume | 42,470 |
Day high | $14.75 | Avg. volume | 508,216 |
50-day MA | $14.18 | Dividend yield | 2.71% |
200-day MA | $15.88 | Market Cap | 1.67B |
Xenia Hotels & Resorts, Inc. (XHR) Company Bio
Xenia Hotel & Resorts Inc. invests primarily in premium full service, lifestyle and urban upscale hotels, with a focus on the top 25 U.S. lodging markets as well as key leisure destinations in the United States. The company was founded in 2014 and is based in Orlando, Florida.
Latest XHR News From Around the Web
Below are the latest news stories about XENIA HOTELS & RESORTS INC that investors may wish to consider to help them evaluate XHR as an investment opportunity.
Hotel REITs Are On Fire — Will The Heat Continue?When it comes to choosing stocks that will outperform over the short or long term, investors can compare the relative strength of an individual stock or sector to other stocks or the benchmark index to assess the likelihood of ongoing good performance. When institutions buy stocks, they can only do small amounts at a time so as not to increase the prices paid. So when you see strong performance in a stock or sector, it’s likely to continue for a while, as the institutions continue to purchase mo |
Xenia Hotels & Resorts – Consensus Indicates Potential 18.4% UpsideXenia Hotels & Resorts found using ticker (XHR) now have 8 analysts covering the stock with the consensus suggesting a rating of ''Buy''. The target price ranges between 20 and 13 calculating the average target price we see 16.5. Now with the previous closing price of 13.94 this now indicates there is a potential upside of 18.4%. The day 50 moving average is 14.22 and the 200 moving average now moves to 15.99. The company has a market cap of $1,696m. Visit the company website at: https://www.xeniareit.com [stock_market_widget type="chart" template="basic" color="green" assets="XHR" range="6mo" interval="1d" axes="true" cursor="true" api="yf"] The potential market cap would be $2,007m based on the market concensus. Xenia Hotels & Resorts is a self-advised and self-administered REIT that ... |
Following a 26% decline over last year, recent gains may please Xenia Hotels & Resorts, Inc. (NYSE:XHR) institutional ownersTo get a sense of who is truly in control of Xenia Hotels & Resorts, Inc. ( NYSE:XHR ), it is important to understand... |
XENIA HOTELS & RESORTS UPSIZES AND EXTENDS CREDIT FACILITY WITH $675 MILLION REFINANCINGXenia Hotels & Resorts, Inc. (NYSE: XHR) ("Xenia" or the "Company") today announced that it has successfully obtained a new $675 million senior unsecured credit facility ("Credit Facility"). The Credit Facility is comprised of a $450 million revolving line of credit ("Revolving Credit Facility"), a $125 million term loan ("Initial Term Loan"), and a $100 million delayed draw term loan ("Delayed Draw Term Loan"). |
XENIA HOTELS & RESORTS ANNOUNCES TIMING OF FOURTH QUARTER AND FULL YEAR 2022 EARNINGS RELEASE AND CONFERENCE CALLXenia Hotels & Resorts, Inc. (NYSE: XHR) ("Xenia" or the "Company") will report financial results for the fourth quarter and full year 2022 before the market opens on Wednesday, March 1, 2023. Management will discuss the Company's results during a conference call at 1:00 pm (Eastern Time) that day. |
XHR Price Returns
1-mo | 11.23% |
3-mo | -13.59% |
6-mo | -10.15% |
1-year | -11.17% |
3-year | -18.23% |
5-year | -23.51% |
YTD | 11.23% |
2022 | -26.13% |
2021 | 19.14% |
2020 | -27.75% |
2019 | 32.33% |
2018 | -15.96% |
XHR Dividends
Ex-Dividend Date | Type | Payout Amount | Change | ||||||
---|---|---|---|---|---|---|---|---|---|
Loading, please wait... |
Continue Researching XHR
Want to do more research on Xenia Hotels & Resorts Inc's stock and its price? Try the links below:Xenia Hotels & Resorts Inc (XHR) Stock Price | Nasdaq
Xenia Hotels & Resorts Inc (XHR) Stock Quote, History and News - Yahoo Finance
Xenia Hotels & Resorts Inc (XHR) Stock Price and Basic Information | MarketWatch
Loading social stream, please wait...