
XPEL, Inc. (XPEL): Price and Financial Metrics
XPEL Price/Volume Stats
| Current price | $39.63 | 52-week high | $86.67 |
| Prev. close | $37.38 | 52-week low | $30.75 |
| Day low | $36.83 | Volume | 247,400 |
| Day high | $39.65 | Avg. volume | 200,678 |
| 50-day MA | $36.35 | Dividend yield | N/A |
| 200-day MA | $47.61 | Market Cap | 1.10B |
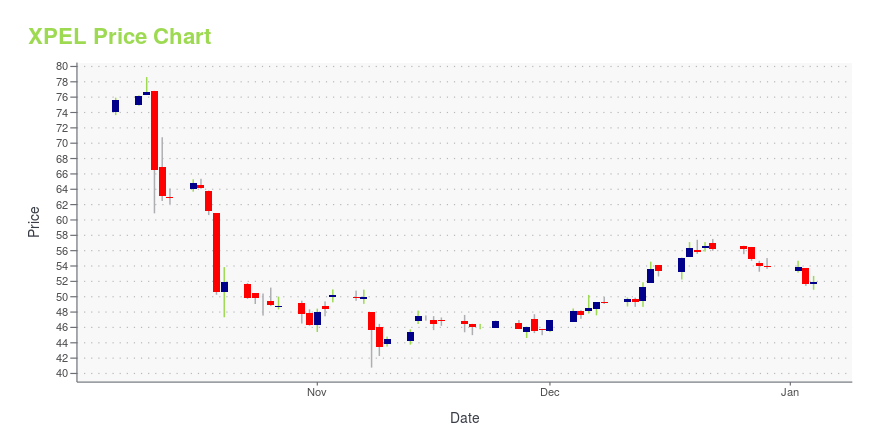
XPEL Stock Price Chart Interactive Chart >
XPEL, Inc. (XPEL) Company Bio
XPEL, Inc. develops and manufactures automotive protection products. The Company offers window and cut-to-fit protective film for the painted surfaces of automobiles, as well as provides design access program software. XPEL serves customers worldwide.
Latest XPEL News From Around the Web
Below are the latest news stories about XPEL INC that investors may wish to consider to help them evaluate XPEL as an investment opportunity.
XPEL Inc (XPEL) Reports Double-Digit Revenue Growth in Q3 2023Net Income and EBITDA See Incremental Rise Amidst Operational Challenges |
XPEL Reports Record Revenue of $102.7 Million in Third Quarter 2023SAN ANTONIO, November 08, 2023--XPEL, Inc. (Nasdaq: XPEL) a global provider of protective films and coatings, today announced results for the quarter ended September 30, 2023. |
XPEL's (NASDAQ:XPEL) five-year earnings growth trails the 49% YoY shareholder returnsThe last three months have been tough on XPEL, Inc. ( NASDAQ:XPEL ) shareholders, who have seen the share price decline... |
XPEL Announces Two New Additions to Leadership TeamXPEL, Inc. (Nasdaq: XPEL), a global provider of protective films and coatings, is pleased to announce two new executive hires: Tony Rimas, VP of Revenue and Kim Steiner, VP of People Services. |
XPEL, Inc. to Host Conference Call to Discuss Third Quarter 2023 ResultsSAN ANTONIO, October 24, 2023--XPEL, Inc. (Nasdaq: XPEL) a global provider of protective films and coatings, today announced it will host a conference call and webcast on Wednesday, November 8, 2023 at 11:00 a.m. Eastern Time to discuss the Company’s third quarter 2023 results. |
XPEL Price Returns
| 1-mo | 13.07% |
| 3-mo | -27.60% |
| 6-mo | -27.83% |
| 1-year | -48.34% |
| 3-year | -53.70% |
| 5-year | 503.20% |
| YTD | -26.41% |
| 2023 | -10.34% |
| 2022 | -12.04% |
| 2021 | 32.43% |
| 2020 | 251.95% |
| 2019 | 140.10% |
Loading social stream, please wait...