Ziff Davis Inc. (ZD): Price and Financial Metrics
ZD Price/Volume Stats
Current price | $63.69 | 52-week high | $94.58 |
Prev. close | $64.19 | 52-week low | $58.08 |
Day low | $63.42 | Volume | 300,900 |
Day high | $64.78 | Avg. volume | 315,436 |
50-day MA | $67.53 | Dividend yield | N/A |
200-day MA | $73.42 | Market Cap | 2.95B |
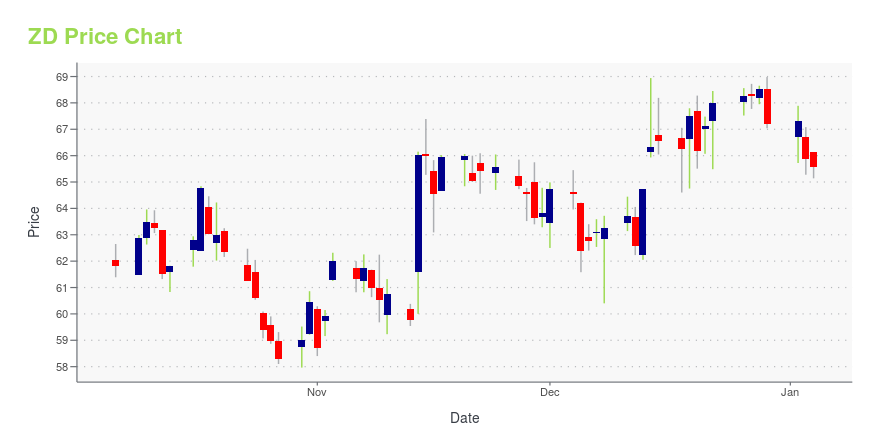
ZD Stock Price Chart Interactive Chart >
ZD POWR Grades
- ZD scores best on the Quality dimension, with a Quality rank ahead of 85.54% of US stocks.
- ZD's strongest trending metric is Stability; it's been moving down over the last 177 days.
- ZD ranks lowest in Momentum; there it ranks in the 32nd percentile.
ZD Stock Summary
- ZD's current price/earnings ratio is 32.69, which is higher than 79.59% of US stocks with positive earnings.
- With a year-over-year growth in debt of -14.57%, ZIFF DAVIS INC's debt growth rate surpasses just 20.31% of about US stocks.
- Over the past twelve months, ZD has reported earnings growth of -59.14%, putting it ahead of just 22.27% of US stocks in our set.
- Stocks with similar financial metrics, market capitalization, and price volatility to ZIFF DAVIS INC are AVNS, GOLF, AQB, ARTW, and TNC.
- ZD's SEC filings can be seen here. And to visit ZIFF DAVIS INC's official web site, go to www.ziffdavis.com.
ZD Valuation Summary
- ZD's price/earnings ratio is 33.2; this is 115.58% higher than that of the median Communication Services stock.
- ZD's EV/EBIT ratio has moved down 19.1 over the prior 243 months.
Below are key valuation metrics over time for ZD.
Stock | Date | P/S | P/B | P/E | EV/EBIT |
---|---|---|---|---|---|
ZD | 2023-09-21 | 2.3 | 1.7 | 33.2 | 20.1 |
ZD | 2023-09-20 | 2.3 | 1.7 | 32.9 | 19.9 |
ZD | 2023-09-19 | 2.3 | 1.7 | 32.8 | 19.9 |
ZD | 2023-09-18 | 2.2 | 1.6 | 32.4 | 19.7 |
ZD | 2023-09-15 | 2.3 | 1.7 | 32.7 | 19.8 |
ZD | 2023-09-14 | 2.3 | 1.7 | 33.2 | 20.1 |
ZD Growth Metrics
- Its 2 year net cashflow from operations growth rate is now at 14.23%.
- Its year over year net income to common stockholders growth rate is now at 88.66%.
- The 2 year net income to common stockholders growth rate now stands at 146.36%.

The table below shows ZD's growth in key financial areas (numbers in millions of US dollars).
Date | Revenue | Operating Cash Flow | Net Income to Common Stock |
---|---|---|---|
2022-09-30 | 1,139.539 | 379.503 | 356.791 |
2022-06-30 | 1,241.918 | 418.998 | 381.175 |
2022-03-31 | 1,333.606 | 454.323 | 443.328 |
2021-12-31 | 1,416.722 | 516.536 | 496.714 |
2021-09-30 | 1,740.721 | 554.322 | 194.296 |
2021-06-30 | 1,653.445 | 528.474 | 212.61 |
ZD's Quality Factors
The “Quality” component of the POWR Ratings focuses on 31 different factors of a companies fundamentals and operational strength. Here are some key insights as we drill into the specifics of these quality attributes.- ZD has a Quality Grade of B, ranking ahead of 77.39% of graded US stocks.
- ZD's asset turnover comes in at 0.459 -- ranking 22nd of 64 Communication stocks.
- GOGO, AMCX, and BBGI are the stocks whose asset turnover ratios are most correlated with ZD.
The table below shows ZD's key quality metrics over time.
Period | Asset Turnover | Gross Margin | ROIC |
---|---|---|---|
2021-06-30 | 0.459 | 0.857 | 0.243 |
2021-03-31 | 0.440 | 0.852 | 0.275 |
2020-12-31 | 0.432 | 0.844 | 0.217 |
2020-09-30 | 0.418 | 0.834 | 0.197 |
2020-06-30 | 0.429 | 0.829 | 0.166 |
2020-03-31 | 0.447 | 0.825 | 0.160 |
ZD Price Target
For more insight on analysts targets of ZD, see our ZD price target page. And for a list of of all stocks sorted by upside potential based on analyst target price, see our Top Price Target page.
Average Price Target | $176.30 | Average Broker Recommendation | 1.39 (Strong Buy) |
Ziff Davis Inc. (ZD) Company Bio
Ziff Davis, Inc. is an Internet information and services company, which engages in the digital media and cloud services business. The firm operates through the following segments: Fax and Martech; Voice, Backup, Security, and Consumer Privacy and Protection; and Digital Media. The company was founded by Jaye Muller and John F. Rieley in December 1995 and is headquartered in Los Angeles, CA.
Latest ZD News From Around the Web
Below are the latest news stories about ZIFF DAVIS INC that investors may wish to consider to help them evaluate ZD as an investment opportunity.
Castle Connolly Releases Castle Connolly Top Hispanic & Latino Doctors 2023For the first time, list recognizes 234 leading Hispanic and Latino doctors in the nationNEW YORK, NY / ACCESSWIRE / September 26, 2023 / Castle Connolly today announced the release of Castle Connolly Top Hispanic & Latino Doctors 2023. It's the first ... |
Health eCareers and ANA-Illinois Expand PartnershipHealth eCareers, North America's leading recruitment and career network serving healthcare professionals, employers, and associations, announced today it has expanded its publications partnership with The American Nurses Association of Illinois to include career center management. |
Jana Barsten Appointed to Ziff Davis Board of DirectorsNEW YORK, August 09, 2023--Ziff Davis, Inc. (NASDAQ: ZD), today announced the appointment of Jana Barsten to its Board of Directors, effective November 13, 2023. Barsten is a public accounting executive with deep experience in the internet, software, and services industries. |
Ziff Davis Reports Second Quarter 2023 Financial Results and Reaffirms 2023 GuidanceNEW YORK, August 03, 2023--Ziff Davis, Inc. (NASDAQ: ZD) ("Ziff Davis" or "the Company") today reported unaudited financial results for the second quarter ended June 30, 2023. |
Ziff Davis & Xyla Partner to Drive Innovation Using Artificial Intelligence; Initial Focus in Healthcare VerticalNEW YORK & LOS ANGELES, August 02, 2023--Ziff Davis, Inc. (Nasdaq: ZD), a vertically focused digital media and internet company, and Xyla, Inc., an artificial intelligence (AI) company at the forefront of the development of retrieval-augmented large language model AI systems for accuracy-critical domains, have entered into a strategic partnership focused on AI enablement across digital media, software, and information services. |
ZD Price Returns
1-mo | -5.98% |
3-mo | N/A |
6-mo | -15.99% |
1-year | -6.99% |
3-year | -9.45% |
5-year | -18.22% |
YTD | -19.48% |
2022 | -28.65% |
2021 | 13.48% |
2020 | 4.25% |
2019 | 36.49% |
2018 | -5.54% |
Loading social stream, please wait...