
Zumiez Inc. (ZUMZ): Price and Financial Metrics
ZUMZ Price/Volume Stats
| Current price | $24.39 | 52-week high | $24.41 |
| Prev. close | $23.57 | 52-week low | $12.90 |
| Day low | $23.57 | Volume | 210,931 |
| Day high | $24.41 | Avg. volume | 230,214 |
| 50-day MA | $19.75 | Dividend yield | N/A |
| 200-day MA | $17.84 | Market Cap | 494.48M |
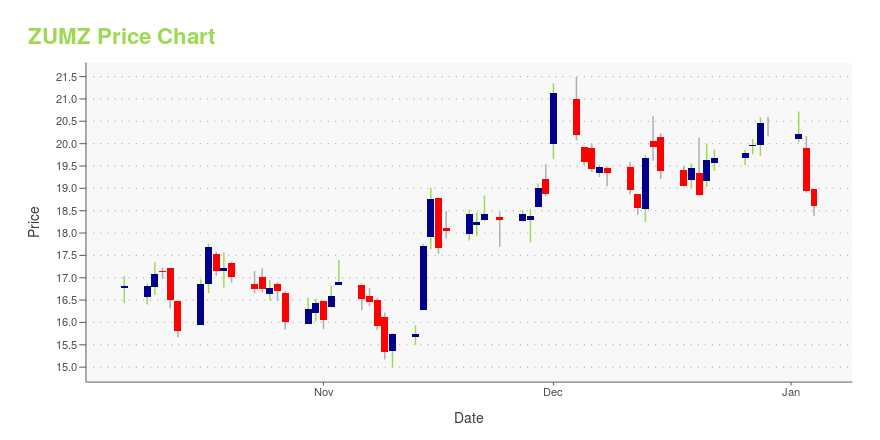
ZUMZ Stock Price Chart Interactive Chart >
Zumiez Inc. (ZUMZ) Company Bio
Zumiez is a specialty retailer of action sports related apparel, footwear, equipment and accessories, focusing on skateboarding, snowboarding, surfing, motocross and BMX for young men and women. The company was founded in 1978 and is based in Lynnwood, Washington.
Latest ZUMZ News From Around the Web
Below are the latest news stories about ZUMIEZ INC that investors may wish to consider to help them evaluate ZUMZ as an investment opportunity.
Zumiez's (ZUMZ) Growth Strategies On Track: Time to Hold?Zumiez's (ZUMZ) business strategies appear encouraging. The company is gaining from its focus on providing differentiated assortments. |
Zumiez Insiders Added US$1.24m Of Stock To Their HoldingsIn the last year, multiple insiders have substantially increased their holdings of Zumiez Inc. ( NASDAQ:ZUMZ ) stock... |
Why Is Zumiez (ZUMZ) Stock Soaring TodayShares of clothing and footwear retailer Zumiez (NASDAQ:ZUMZ) jumped 5.1% in the mid-day session after the company reported third quarter results that blew past analysts' EPS expectations, while revenue came in slightly ahead due to "improving sales trends compared with the first and second quarters". However, the company noted that "sales trends pulled back somewhat during the second half of Q3 after the peak back-to-school season." Looking ahead, next quarter's revenue guidance came in higher |
Zumiez's (ZUMZ) Q3 Loss Narrower Than Expected, Revenues DownZumiez's (ZUMZ) third-quarter fiscal 2023 results were hurt by inflationary pressures, a promotional landscape, increased costs and foreign currency headwinds. |
Zumiez Inc. (NASDAQ:ZUMZ) Q3 2023 Earnings Call TranscriptZumiez Inc. (NASDAQ:ZUMZ) Q3 2023 Earnings Call Transcript November 30, 2023 Zumiez Inc. beats earnings expectations. Reported EPS is $-0.12, expectations were $-0.17. Operator: Good afternoon, ladies and gentlemen. Welcome to the Zumiez Inc. Third Quarter Fiscal 2023 Earnings Conference Call. [Operator Instructions] Before we begin, I’d like to remind everyone in the company’s safe […] |
ZUMZ Price Returns
| 1-mo | 26.05% |
| 3-mo | 43.89% |
| 6-mo | 37.41% |
| 1-year | 30.01% |
| 3-year | -43.13% |
| 5-year | -6.12% |
| YTD | 19.91% |
| 2023 | -6.44% |
| 2022 | -54.70% |
| 2021 | 30.48% |
| 2020 | 6.49% |
| 2019 | 80.18% |
Continue Researching ZUMZ
Want to do more research on Zumiez Inc's stock and its price? Try the links below:Zumiez Inc (ZUMZ) Stock Price | Nasdaq
Zumiez Inc (ZUMZ) Stock Quote, History and News - Yahoo Finance
Zumiez Inc (ZUMZ) Stock Price and Basic Information | MarketWatch
Loading social stream, please wait...