Zovio Inc. (ZVO): Price and Financial Metrics
GET POWR RATINGS... FREE!
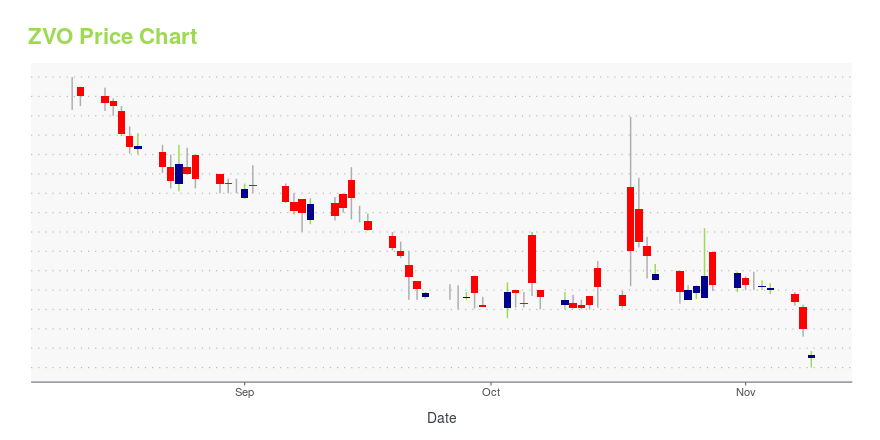
ZVO Stock Price Chart Interactive Chart >
ZVO Price/Volume Stats
Current price | $0.09 | 52-week high | $1.79 |
Prev. close | $0.12 | 52-week low | $0.08 |
Day low | $0.08 | Volume | 5,155,600 |
Day high | $0.10 | Avg. volume | 2,068,574 |
50-day MA | $0.18 | Dividend yield | N/A |
200-day MA | $0.68 | Market Cap | 3.18M |
Zovio Inc. (ZVO) Company Bio
Zovio Inc. (formerly Brightpoint Education) provides postsecondary education services. Its academic institutions, Ashford University and University of the Rockies, offer associate\'s, bachelor\'s, master\'s, and doctoral degree programs in the disciplines of business, education, psychology, social sciences, and health sciences. The company was founded in 1999 and is based in San Diego, California.
Latest ZVO News From Around the Web
Below are the latest news stories about ZOVIO INC that investors may wish to consider to help them evaluate ZVO as an investment opportunity.
Today’s Biggest Pre-Market Stock Movers: 10 Top Gainers and Losers on WednesdayWe're starting off the day with a breakdown of the biggest pre-market stock movers traders need to know about on Wednesday! |
Today’s Biggest Pre-Market Stock Movers: 10 Top Gainers and Losers on FridayPre-market stock movers continue to be a major topic as we dive into the latest news investors need to know about on Friday! |
Today’s Biggest Pre-Market Stock Movers: 10 Top Gainers and Losers on TuesdayIt's time for another look at the biggest pre-market stock movers as we check out what's happening with shares on Tuesday morning! |
Zovio (ZVO) Stock Soars 90% Ahead of Oct. 25 Dissolution VoteZovio (ZVO) stock is rocketing higher on Tuesday as investors prepare for an incredibly important vote next week! |
Today’s Biggest Pre-Market Stock Movers: 10 Top Gainers and Losers on ThursdayGood morning, investor! |
ZVO Price Returns
1-mo | N/A |
3-mo | N/A |
6-mo | -40.40% |
1-year | -90.04% |
3-year | -93.08% |
5-year | -98.65% |
YTD | N/A |
2022 | 0.00% |
2021 | -73.21% |
2020 | 130.10% |
2019 | -70.61% |
2018 | -15.54% |
Loading social stream, please wait...