Deckers Outdoor Corporation (DECK): Price and Financial Metrics
GET POWR RATINGS... FREE!
DECK POWR Grades
- DECK scores best on the Quality dimension, with a Quality rank ahead of 95.36% of US stocks.
- DECK's strongest trending metric is Stability; it's been moving up over the last 179 days.
- DECK's current lowest rank is in the Stability metric (where it is better than 20.82% of US stocks).
DECK Stock Summary
- With a one year PEG ratio of 126.82, Deckers Outdoor Corp is expected to have a higher PEG ratio (a measure of how expensive a stock is relative to its expected earnings growth) than 82.15% of US stocks.
- Of note is the ratio of Deckers Outdoor Corp's sales and general administrative expense to its total operating expenses; 85.61% of US stocks have a lower such ratio.
- For DECK, its debt to operating expenses ratio is greater than that reported by merely 20.55% of US equities we're observing.
- Stocks that are quantitatively similar to DECK, based on their financial statements, market capitalization, and price volatility, are SKX, CNXC, RL, YETI, and WSO.
- Visit DECK's SEC page to see the company's official filings. To visit the company's web site, go to www.deckers.com.
DECK Valuation Summary
- In comparison to the median Consumer Cyclical stock, DECK's price/sales ratio is 35.48% higher, now standing at 4.2.
- DECK's price/sales ratio has moved up 3.8 over the prior 243 months.
- Over the past 243 months, DECK's price/earnings ratio has gone up 14.5.
Below are key valuation metrics over time for DECK.
Stock | Date | P/S | P/B | P/E | EV/EBIT |
---|---|---|---|---|---|
DECK | 2021-08-27 | 4.2 | 8.3 | 26.7 | 19.0 |
DECK | 2021-08-26 | 4.2 | 8.2 | 26.7 | 19.0 |
DECK | 2021-08-25 | 4.3 | 8.4 | 27.2 | 19.4 |
DECK | 2021-08-24 | 4.4 | 8.5 | 27.4 | 19.6 |
DECK | 2021-08-23 | 4.3 | 8.5 | 27.3 | 19.5 |
DECK | 2021-08-20 | 4.3 | 8.5 | 27.4 | 19.6 |
DECK Growth Metrics
- Its 2 year price growth rate is now at 78.02%.
- Its 5 year net income to common stockholders growth rate is now at 125.86%.
- Its year over year revenue growth rate is now at 19.36%.

The table below shows DECK's growth in key financial areas (numbers in millions of US dollars).
Date | Revenue | Operating Cash Flow | Net Income to Common Stock |
---|---|---|---|
2021-12-31 | 2,975.52 | 301.325 | 416.588 |
2021-09-30 | 2,865.527 | 439.504 | 439.181 |
2021-06-30 | 2,767.15 | 538.716 | 438.672 |
2021-03-31 | 2,545.641 | 596.217 | 382.575 |
2020-12-31 | 2,359.363 | 569.871 | 365.207 |
2020-09-30 | 2,220.339 | 486.529 | 311.264 |
DECK's Quality Factors
The “Quality” component of the POWR Ratings focuses on 31 different factors of a companies fundamentals and operational strength. Here are some key insights as we drill into the specifics of these quality attributes.- DECK has a Quality Grade of A, ranking ahead of 96.92% of graded US stocks.
- DECK's asset turnover comes in at 1.244 -- ranking 9th of 32 Apparel stocks.
- LULU, GES, and PVH are the stocks whose asset turnover ratios are most correlated with DECK.
The table below shows DECK's key quality metrics over time.
Period | Asset Turnover | Gross Margin | ROIC |
---|---|---|---|
2021-06-30 | 1.244 | 0.539 | 0.624 |
2021-03-31 | 1.204 | 0.540 | 0.534 |
2020-12-31 | 1.172 | 0.538 | 0.462 |
2020-09-30 | 1.176 | 0.523 | 0.376 |
2020-06-30 | 1.189 | 0.522 | 0.337 |
2020-03-31 | 1.202 | 0.518 | 0.316 |
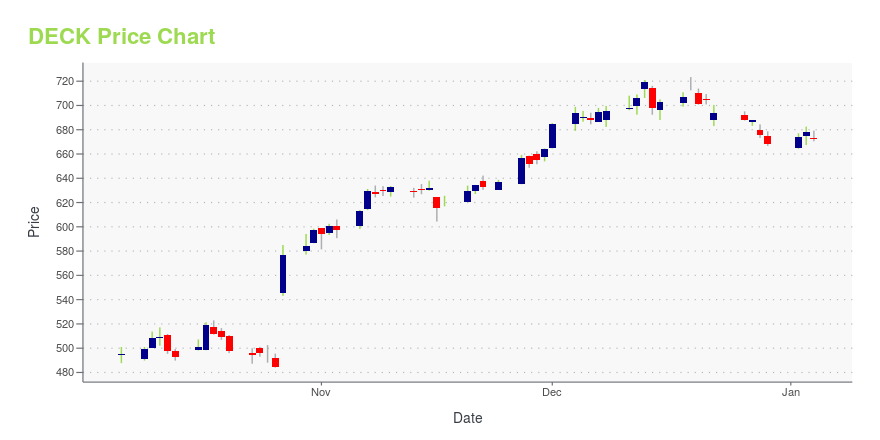
DECK Stock Price Chart Interactive Chart >
DECK Price/Volume Stats
Current price | $327.31 | 52-week high | $451.49 |
Prev. close | $337.13 | 52-week low | $212.93 |
Day low | $326.13 | Volume | 264,308 |
Day high | $336.17 | Avg. volume | 429,204 |
50-day MA | $286.20 | Dividend yield | N/A |
200-day MA | $306.87 | Market Cap | 8.68B |
Deckers Outdoor Corporation (DECK) Company Bio
Deckers Outdoor Corporaton designs, markets, and distributes footwear, apparel, and accessories for casual lifestyle use and high performance activities. The Company markets its products under three brands: UGG, Teva, and Sanuk. The company was founded in 1973 and is based in Goleta, California.
Latest DECK News From Around the Web
Below are the latest news stories about Deckers Outdoor Corp that investors may wish to consider to help them evaluate DECK as an investment opportunity.
Pandemic led to ‘running renaissance’ that could last a decade, Brooks Running CEO saysBrooks Running CEO Jim Weber joins Yahoo Finance Live to discuss secular growth for the company, earnings amid growing U.S. running shoe market, and top sneaker trends. |
Deckers Outdoor Corporation: An Attractive Play At An Attractive PriceNo summary available. |
Is It Time To Consider Buying Deckers Outdoor Corporation (NYSE:DECK)?While Deckers Outdoor Corporation ( NYSE:DECK ) might not be the most widely known stock at the moment, it saw... |
Were Hedge Funds Illusioned With Deckers Outdoor Corp (DECK)?Stocks, especially the once high flying technology stocks, had a lousy start to the new year. QQQ lost 9% of its value in January. |
Deckers Outdoor Corporation (DECK) CEO Dave Powers on Q3 2022 Results - Earnings Call TranscriptDeckers Outdoor Corporation (DECK) Q3 2022 Earnings Conference Call Feb 03, 2021, 04:30 PM ET Company Participants Erinn Kohler - Vice President-Investor Relations and Corporate Planning Dave Powers - President and CEO Steve Fasching - CFO Conference Call Participants Camilo Lyon - BTIG Laurent Vasilescu - Exane BNP Jonathan Komp... |
DECK Price Returns
1-mo | 10.31% |
3-mo | 28.22% |
6-mo | 10.48% |
1-year | -23.46% |
3-year | 138.16% |
5-year | 414.96% |
YTD | -10.65% |
2021 | 27.73% |
2020 | 69.83% |
2019 | 31.97% |
2018 | 59.44% |
2017 | 44.88% |
Continue Researching DECK
Here are a few links from around the web to help you further your research on Deckers Outdoor Corp's stock as an investment opportunity:Deckers Outdoor Corp (DECK) Stock Price | Nasdaq
Deckers Outdoor Corp (DECK) Stock Quote, History and News - Yahoo Finance
Deckers Outdoor Corp (DECK) Stock Price and Basic Information | MarketWatch
Loading social stream, please wait...