Genesco Inc. (GCO): Price and Financial Metrics

Genesco Inc. (GCO): $27.70

0.57 (+2.10%)

POWR Rating

Component Grades

Momentum

C

Stability

D

Sentiment

Quality

C

Add GCO to Watchlist
Sign Up

Industry: Fashion & Luxury

Industry

B

Ranked

#47 of 61

in industry

GCO Price/Volume Stats
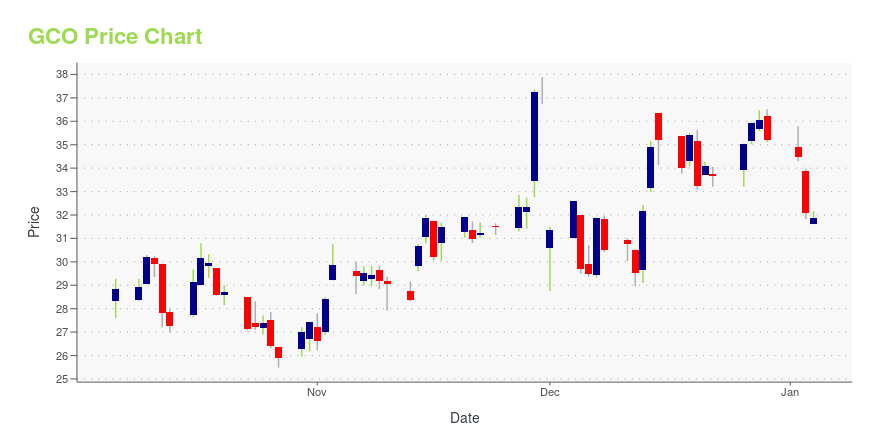
Current price $27.70 52-week high $38.26
Prev. close $27.13 52-week low $17.31
Day low $27.27 Volume 24,615
Day high $27.72 Avg. volume 121,287
50-day MA $28.60 Dividend yield N/A
200-day MA $28.99 Market Cap 318.25M

GCO Stock Price Chart Interactive Chart >

GCO POWR Grades

  • Value is the dimension where GCO ranks best; there it ranks ahead of 78.54% of US stocks.
  • GCO's strongest trending metric is Growth; it's been moving up over the last 26 weeks.
  • GCO ranks lowest in Stability; there it ranks in the 14th percentile.

GCO Stock Summary

  • The capital turnover (annual revenue relative to shareholder's equity) for GCO is 4.3 -- better than 88.46% of US stocks.
  • GENESCO INC's stock had its IPO on January 1, 1986, making it an older stock than 92.92% of US equities in our set.
  • With a price/sales ratio of 0.16, GENESCO INC has a higher such ratio than merely 4.19% of stocks in our set.
  • Stocks that are quantitatively similar to GCO, based on their financial statements, market capitalization, and price volatility, are TBI, STRT, SSNT, PUYI, and THG.
  • GCO's SEC filings can be seen here. And to visit GENESCO INC's official web site, go to www.genesco.com.

GCO Valuation Summary

  • GCO's price/sales ratio is 0.2; this is 90% lower than that of the median Consumer Cyclical stock.
  • Over the past 243 months, GCO's price/sales ratio has gone down 0.2.

Below are key valuation metrics over time for GCO.

Stock Date P/S P/B P/E EV/EBIT
GCO 2023-12-29 0.2 0.8 -79.8 -601.7
GCO 2023-12-28 0.2 0.8 -81.7 -607.3
GCO 2023-12-27 0.2 0.8 -81.5 -606.6
GCO 2023-12-26 0.2 0.7 -79.4 -600.4
GCO 2023-12-22 0.2 0.7 -76.3 -591.4
GCO 2023-12-21 0.2 0.7 -77.3 -594.4

GCO Growth Metrics

    Its 5 year net income to common stockholders growth rate is now at -190.71%.
  • The 5 year price growth rate now stands at -38.83%.
  • The 2 year price growth rate now stands at 170.44%.
Over the past 49 months, GCO's revenue has gone down $554,775,000.

The table below shows GCO's growth in key financial areas (numbers in millions of US dollars).

Date Revenue Operating Cash Flow Net Income to Common Stock
2022-09-30 2,387.528 -156.214 95.106
2022-06-30 2,384.286 -110.116 107.625
2022-03-31 2,404.137 103.617 110.919
2021-12-31 2,422.084 239.87 114.85
2021-09-30 2,331.225 258.553 142.628
2021-06-30 2,209.959 236.913 117.199

GCO's Quality Factors

The “Quality” component of the POWR Ratings focuses on 31 different factors of a companies fundamentals and operational strength. Here are some key insights as we drill into the specifics of these quality attributes.
  • GCO has a Quality Grade of A, ranking ahead of 96.39% of graded US stocks.
  • GCO's asset turnover comes in at 1.372 -- ranking 89th of 165 Retail stocks.
  • FAST, TTSH, and WMT are the stocks whose asset turnover ratios are most correlated with GCO.

The table below shows GCO's key quality metrics over time.

Period Asset Turnover Gross Margin ROIC
2021-07-31 1.372 0.474 0.061
2021-05-01 1.248 0.460 0.037
2021-01-30 1.075 0.450 -0.059
2020-10-31 1.084 0.454 -0.066
2020-08-01 1.079 0.461 -0.054
2020-05-02 1.136 0.474 -0.040

GCO Price Target

For more insight on analysts targets of GCO, see our GCO price target page. And for a list of of all stocks sorted by upside potential based on analyst target price, see our Top Price Target page.

Average Price Target $69.00 Average Broker Recommendation 1.83 (Hold)

Genesco Inc. (GCO) Company Bio


Genesco Inc. engages in the retail and wholesale of footwear, apparel, and accessories. The company operates in five segments: Journeys Group, Schuh Group, Lids Sports Group, Johnston & Murphy Group, and Licensed Brands. The company was founded in 1924 and is based in Nashville, Tennessee.


GCO Latest News Stream


Event/Time News Detail
Loading, please wait...

GCO Latest Social Stream


Loading social stream, please wait...

View Full GCO Social Stream

Latest GCO News From Around the Web

Below are the latest news stories about GENESCO INC that investors may wish to consider to help them evaluate GCO as an investment opportunity.

Calculating The Fair Value Of Genesco Inc. (NYSE:GCO)

Key Insights Genesco's estimated fair value is US$35.66 based on 2 Stage Free Cash Flow to Equity With US$31.88 share...

Yahoo | December 8, 2023

Genesco Inc. (NYSE:GCO) Q3 2024 Earnings Call Transcript

Genesco Inc. (NYSE:GCO) Q3 2024 Earnings Call Transcript December 1, 2023 Genesco Inc. misses on earnings expectations. Reported EPS is $0.57 EPS, expectations were $0.84. Operator: Good day, everyone, and welcome to Genesco’s Third Quarter Fiscal 2024 Conference Call. Just a reminder, today’s call is being recorded. I will now turn the call over to […]

Yahoo | December 4, 2023

Q3 2024 Genesco Inc Earnings Call

Q3 2024 Genesco Inc Earnings Call

Yahoo | December 2, 2023

Why Genesco (GCO) Shares Are Plunging Today

Shares of footwear, apparel, and accessories retailer Genesco (NYSE:GCO) fell 12.2% in the morning session after the company reported third quarter results with same-store sales, revenue, and EPS all falling below Wall Street's expectations. Management blamed "a challenging operating environment" and a delayed ERP system implementation internally for the weakness. Consumer demand remains "choppy" and Genesco plans to increase promotions to bring in shoppers, which will likely lead to weaker gros

Yahoo | December 1, 2023

Genesco Expects Increased Holiday Promotional Activity at Journeys After Mixed Q3

The Nashville-based footwear company reported net sales of $579 million in the third quarter, a decrease of 4 percent from $604 million the year prior.

Yahoo | December 1, 2023

Read More 'GCO' Stories Here

GCO Price Returns

1-mo -13.27%
3-mo -21.33%
6-mo -10.12%
1-year -24.54%
3-year -39.11%
5-year -39.19%
YTD -21.33%
2023 -23.49%
2022 -28.28%
2021 113.26%
2020 -37.21%
2019 8.17%

Continue Researching GCO

Here are a few links from around the web to help you further your research on Genesco Inc's stock as an investment opportunity:

Genesco Inc (GCO) Stock Price | Nasdaq
Genesco Inc (GCO) Stock Quote, History and News - Yahoo Finance
Genesco Inc (GCO) Stock Price and Basic Information | MarketWatch

Get Free Updates

Join thousands of investors who get the latest news, insights and top rated picks from StockNews.com!