

I think we can all agree that it’s important to know if a recession is coming, given that 82% of the bear markets since WWII have occurred during such market downturns.
The current US economic expansion is now in its 10th year and breaks the record for the longest in history on July 1st, 2019. So naturally many investors fear that the current expansion and bull market are “long in the tooth” and due to end fairly soon.
I track the state of the economy very closely each week, using no less than eight time-tested models comprised of dozens of leading indicators. Up until now, the economic fundamentals have been strong but now the most reliable recession predictor ever discovered is flashing red and showing disturbing signs that the recession clock may soon start ticking.
Find out the three things you need to know about why a recession may coming, when it’s most likely to arrive (and when the next bear market is likely to start), and most importantly of all, how you can protect your portfolio from any future economic/market storm.
Why the Bond Market is the Best at Predicting Recessions
On Monday, December 3rd the first of the yield curves (the difference between various maturity durations of treasury bonds) officially inverted trigger the media’s usual sensationalistic headlines. This was from Yahoo.
“The Treasury yield curve just inverted, sounding the alarm for recession”
Now it’s important to note that this was merely the curve between the three and five-year yields, which is one of the dozens of curves that exist. The 3/5 curve is NOT significant, because it lacks sufficient duration difference to meaningfully warn about a recession. But to understand why yield curves matter at all, first we have to know why they are historically the best predictors of recession ever discovered (the 1/10, 2/10 and 2/30 specifically).
According to a March 2018 report from the San Francisco Fed, an inverted yield curve has “correctly signaled all nine recessions since 1955 and had only one false positive, in the mid-1960s, when an inversion was followed by an economic slowdown but not an official recession.”
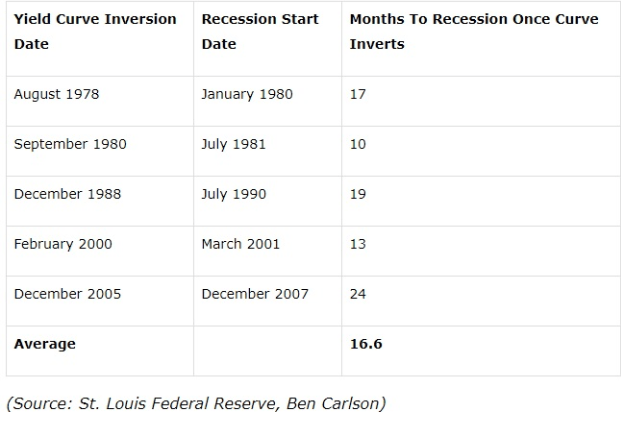
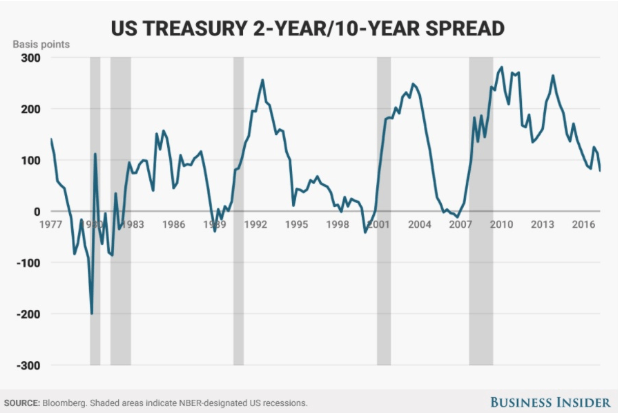
Now officially the yield curve (the 2 year and 10-year yield one) has predicted (with 90% accuracy) recessions with a six to 24 month lead time. But the average time from inversion to the start of a recession in the modern era has been 17 months.
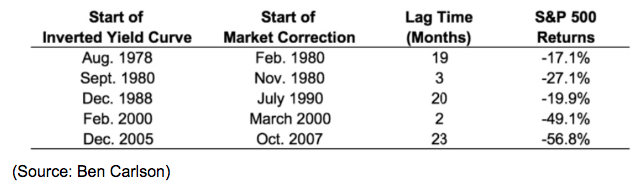
Unfortunately, the curve’s ability to predict the start of the next bear market (when the market peaks) is less powerful. That’s because the forward-looking stock market sometimes ignores an inversion and keeps climbing for nearly two years (as in 2007) or sometimes peaks just two months after an inversion happens. The average lag between a 2/10 inversion and the market topping is 13.4 months, but as you can see from the above table the market tends to either begin falling fairly soon after inversion or take a long time.
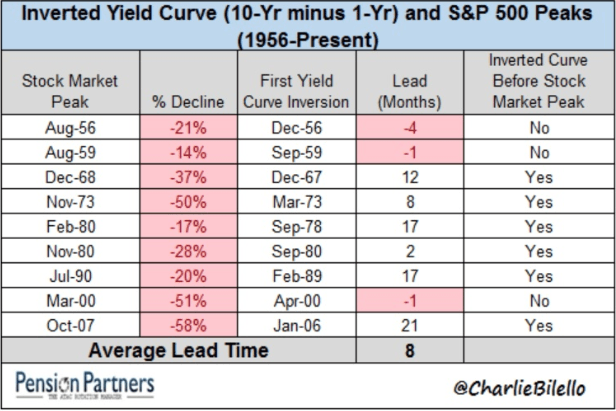
What’s more, using one other famous yield curve, the 1-year and 10-year curve, for which we have data stretching back to the 50s, shows that sometimes stocks can start falling even before the curve officially starts warning of an impending recession. This might prove to be the case this time, due to extreme market fear that could itself trigger a flight to safety that inverts one or more of the important curves.
But why exactly does the yield curve have any predictive power at all? And just how dangerous is the outlook for stocks right now?
Are the Yield Curves Flashing Warning Signs About a Future Recession?
On Tuesday, December 4th, as I write this the 3 most important yield-curves (1/10, 2/10 and 2/30) stand at:
- 1/10: 0.17% (down about 0.1% in 2 weeks)
- 2/10: 0.11% (down about 0.13% in 2 weeks)
- 2/30: 0.37% (down about 0.2% in 2 weeks)
There are two reasons that investors watch these curves so closely. One is that the $20 trillion US bond market is the most liquid major capital market on earth, and is seen as the ultimate safe haven “risk-free” investment. Our bond yields are driven by massive capital flows from insurance companies, pension funds, sovereign wealth funds, and other highly trained professionals whose job it is to keep an eye on the economy.
The other major reason that yield curve matters is because it can become a self-fulfilling prophecy. For example, the latest bank survey from the Dallas Fed shows that banks believe in the yield curve enough that, should the three important ones invert, they plan to pull back on lending to subprime borrowers. Decreased credit to consumers (whose spending drives 65% to 70% of the US economy) is a direct way in which an inverted curve can not just warn of a possible recession but actually cause it.
Another way to think about the yield curve is this. If enough people believe in its recession predicting power, then a flight to safety (out of stock and into bonds) can directly cause the important curves to dive fast and hard, as they are all doing now.
Similarly, the stock market, driven by short-term investor sentiment can feed off that fear, especially given that we’ve been locked in the second correction of the year (a “risk off” sentiment environment). This likely explains why the market, despite rallying in recent days due to the dovish Fed and a truce in the trade war, appears to be falling purely due to yield curve inversion fears.
Ok, so now that we know what the curves are, how accurate they tend to be (and what kind of warning time frame we can expect post inversion), what does that mean for your portfolio? How can you actually use this data to protect your hard earned money and nest-egg?
What You Can Do to Prepare for a Future Recession
The first step in preparing your portfolio for a recession is knowing what asset allocation is best for you personally. That means what the right mix of stocks/bond/cash is most likely to help you meet your long-term goals.
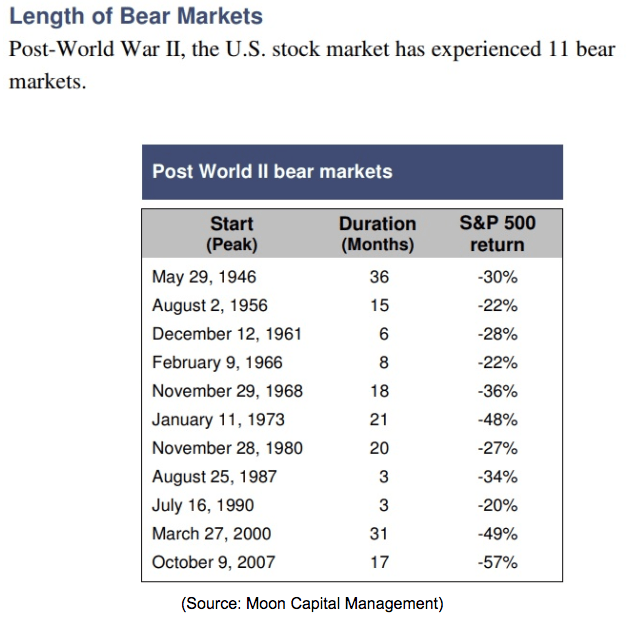
That’s because, since WWII the average bear market (82% of which happen during recessions) has seen stocks fall 34% over a 17 month period. Note that’s the time for the market to go from its previous all-time high (in this case September 20th, 2018) to its ultimate bottom.
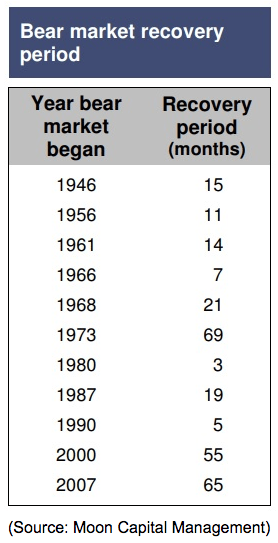
The average recovery time, meaning how long it takes stocks to go from the bear market bottom to fresh all-time highs (the official end of the bear market), is 15 months.
This means the average bear market, measured from the market top to market top, is 32 months long. Of course because the actual duration of these sharp downturns can vary depending on the severity of the recession and how much stocks decline, you want to make sure you have at least three to four years of cash (if you’re retired) factoring in your supplemental income such as Social Security and any pension you may have.
That allows you to avoid panic selling stocks during a market slide. This also applies to those using the popular 4% rule. If you are planning on taking out a set amount of money from your portfolio (like 4%) then make sure you can first draw on cash (or cash equivalents like short-term treasury notes or money market funds) before tapping other assets.
Next, there are bonds. These provide both income but more importantly tend to be countercyclical to stocks during a bear market. That’s both because treasury bonds are a “risk-free” investment that tends to go up during times when investors are fleeing risk assets such as equities. In addition, during recessions, interest rates are falling (Fed cuts short-term rates and long-term rates fall due to lower inflation expectations as well as the flight to safety).
In either case, once your cash is depleted (if you’re spending it to fund living expenses) then bonds are what you tap next (since they are either flat or appreciating in value). Stocks are in your portfolio for long-term capital appreciation (the best performing asset class in history) as well as to generate safe and growing dividends.
If your portfolio is large enough to live entirely off dividends, and you’ve built a diversified collection of blue-chips (like dividend aristocrats) then you’re lucky.
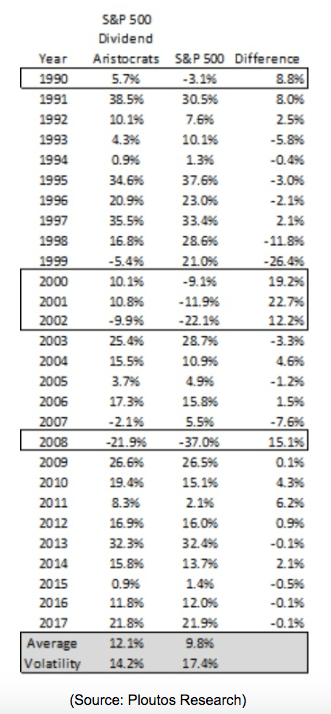
Since 1990 the dividend aristocrats have managed to outperform the market while suffering 18% lower volatility. Most importantly they tend to greatly outperform the market by falling less (or even rising) during recessions. Thus a blue-chip dominated portfolio of dividend stocks can provide you with a safe and growing income, no matter what stock prices are doing.
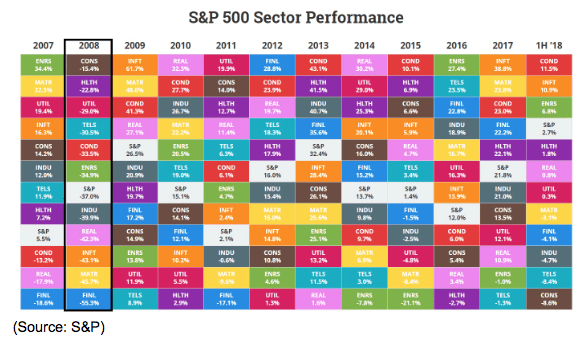
Another way to structure your portfolio (the equity portion) is by focusing more on defensive sectors such as consumer staples, healthcare stocks, utilities, and telecom companies. While most stocks tend to fall during a bear market, defensive stocks (with recession resistant cash flows and safe and rising dividends) tend to fall far less.
It may be small comfort to watch your portfolio decline less than the market in general, but anything that can keep you calm and avoid panic selling is extremely valuable. Remember that numerous studies have shown that not just does market timing not work, but is the most destructive thing for regular investors to try.
Basically, ahead of a recession you should turn to asset allocation, not market timing, to protect your wealth. If you are overexposed to stocks (for your individual risk profile) then, by all means, shift more to bonds and cash, at least enough to ride out a three or four-year bear market. If your stock portfolio is packed to the rafters with economy-sensitive stocks (like high beta technology names and bank stocks) then you might want to shift that towards defensive sectors. And you can’t go wrong with dividend aristocrats and kings. While no stock is ever “risk-free” these are the bluest of the blue chips that are most likely to help you sleep well at night and keep a calm head when the bears run wild on Wall Street.
Bottom Line: It’s Never Time to Panic BUT the Bond Market Is Potentially Signalling it Might Soon Become Time to Start Getting Defensive
I’m a naturally optimistic person and a long-term bull both on the US economy and stock market. However, recessions and bear markets are a natural and healthy part of the economic/market cycle and so all long-term investors need to be aware of what warning signs to watch for.
Right now the yield curves, the most accurate recession predictors ever discovered, are showing troubling signs of distress. Specifically, the bond market appears to have become increasingly bearish about the future growth rate of our economy. It’s important to remember that the 3/5 curve inversion that happened on December 3rd is NOT important, but merely a troubling warning sign that the 7/10 warning curve (preceded 2/10 inversion before the last three recession) might be next to fall. Historically that means that the two most important curves, the 2/10 and 2/30 are not far from inverting and if they go negative (either one) then the official 6 to 24 month (17 average) recession watch clock begins ticking.
The good news is that even once an inversion happens a recession (and market top) are typically about a year (or more) away. This means there is usually plenty of time for investors to prepare their portfolios by shifting to lower-risk assets (while still sticking to their long-term asset allocation strategies) such as defensive stocks. This might include dividend aristocrats, kings, and or defensive sectors such as utilities, telecoms, healthcare, and consumer staples. And of course, building up some cash, either to fund living expenses or take advantage of fantastic bear market bargains, is also a wise idea should the two most important curves (2/10 and 2/30) finally invert.
Above all else always remember that panic is never the answer, and all long-term investing decisions must always be approached methodically and rationally. There is no way to know the future with certainty, but we can use the most time-tested historical recession predictors to make educated probabilistic estimates about when the next downturn is likely to hit, and thus prepare ourselves financially, and emotionally for any economic/market storm that might be coming.
About the Author:

9 "Must Own" Growth Stocks For 2019
Get Free Updates
Join thousands of investors who get the latest news, insights and top rated picks from StockNews.com!
Top Stories on StockNews.com

Best & Worst Performing Mega Cap Stocks for July 9, 2025
AEXAY leads the way today as the best performing mega cap stock, closing up 13.49%.
Best & Worst Performing Mega Cap Stocks for July 8, 2025
AEXAY leads the way today as the best performing mega cap stock, closing up 13.49%.
Best & Worst Performing Mega Cap Stocks for July 7, 2025
AEXAY leads the way today as the best performing mega cap stock, closing up 13.49%.
Best & Worst Performing Mega Cap Stocks for July 4, 2025
AEXAY leads the way today as the best performing mega cap stock, closing up 13.49%.