

The stock market seems to only go one direction these days, down. Understandably that has many investors sweating bullets, thanks to the media constantly hyping all the reasons that stocks might fall 50%, 60%, or even more. These include scary things like:
- The Fed hiking us into a recession
- Slowing global growth
- The trade war with China
- An inverted yield curve
- Brexit chaos
- Crashing oil prices
- Falling earnings growth expectations
If this incredibly fearful market environment has you feeling like stocks are falling unusually fast well guess what? You’re ABSOLUTELY RIGHT! Stocks are indeed falling at a nearly unprecedented rate. But rather than panic over this fact, there are some important reasons you should celebrate it.
Stocks Are Having Their Worst December Since 1931
Through December 19th’s (Monday) close the S&P 500 and Dow Jones Industrial Average were both down 7.8% in December. According to LPL Research, that’s on track for the worst December since 1931, during the peak of the Great Depression when the S&P 500 and DJIA fell 14.5% and 17%, respectively.
But while stocks falling at their fastest rate since the Great Depression might seem terrifying, I’m actually not losing any sleep over it. In fact, I’m actually celebrating the rapid collapse in stock prices and so should you.
Here’s Why That’s a Great Thing
Whenever you see something unusual in the market, such as a decline as sharp and severe as what we’re experiencing, it’s important to step back and put things in context.
For example, the two worst market crashes in US history, (1929 to 1931 and 2007 to 2009) occurred during the Great Depression and The Financial Crisis. For the past eight years, we’ve faced numerous doomsday prophets, such as John Hussman (a hedge fund manager who made a killing in 2008 shorting the market). Hussman has been predicting a 65% market crash since 2010. The current pace of declines seems to indicate that this broken clock might finally be right, or does it?
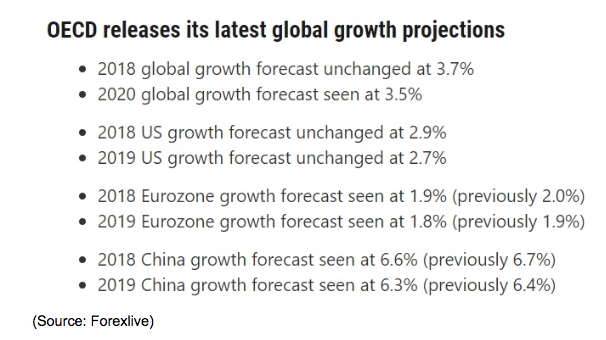
In reality, while global growth (and US growth) is expected to slow (and the latest economic reports confirm it is) we’re very unlikely headed for a global recession.
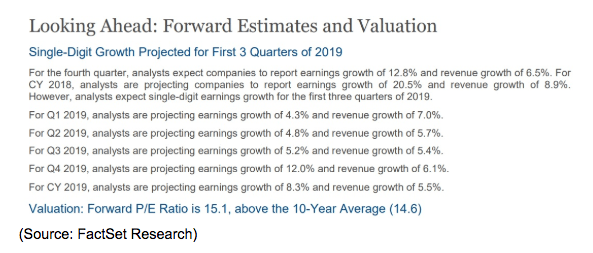
Nor are corporate earnings, the things stock prices are ultimately based on, headed for a collapse. Yes, growth expectations for next year have come down from 10.5% in mid-2018 and fallen to just 8.3% today. And yes falling oil prices mean that the average 3.5% analyst overshoot (over the last 20 years in non-recession years) might mean that actual S&P 500 earnings growth next year (and in 2020) is closer to 5% to 6%.
But consider this. As of Monday’s close, the S&P 500’s forward PE was 14.8, which is right in line with the 10-year average (and that includes the 57% market crash during the Great Recession).
Don’t trust forward earnings because those expectations are so fickle? Well then consider the S&P 500’s 19.6 TTM PE as of Monday. Seems high right? Actually, it’s not.
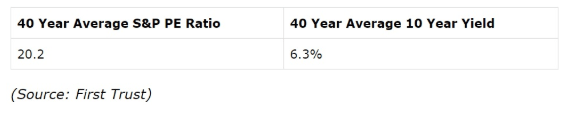
Over the past 40 years, the average TTM PE for the market has been 20.2, and that was with long-term interest rates averaging 6.3% and average S&P 500 earnings growth of 5.8%. Today the 10-year yield is 2.85% implying that stocks are likely undervalued even if earnings next year grows at 5% to 6%, which they are likely to (and which would be their historically normal rate). Or to put another way, in order to get a Hussman predicted, 2008/1929 style crash you either need a major recession or crazy market valuations. Despite what many in the financial media might tell you, today we have neither of those things nor are likely to see them soon.
And here’s another thing to consider. Two of the biggest risks the market is worried about, the trade war and the Fed, are also being limited by the very same crashing stock prices that are keeping many investors up at night.
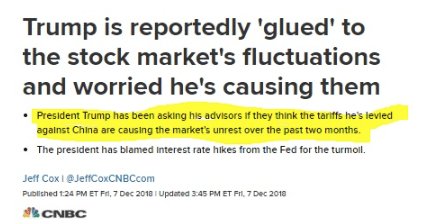
It was the stock market correction that likely allowed for the current trade truce because Trump incorrectly assumes the stock market is a great indicator of the health of the economy (it’s not these 3 things are what you should watch instead). But regardless, the fact that Trump seems to fear a bear market might be coming and bring with it a recession that would sink his re-election chances, is likely why trade negotiations are now going so well.
And what about the Fed? Well, the Fed is mainly worried about an overheating economy that will send inflation above its long-term target rate of 2.0%.
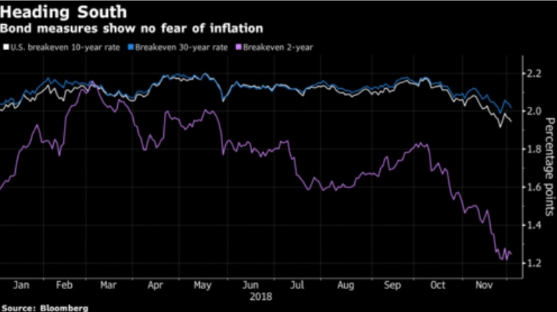
The bond market is now expecting long-term inflation (1.9%) below the Fed’s target and over the next two years for price growth of just 1.2%.
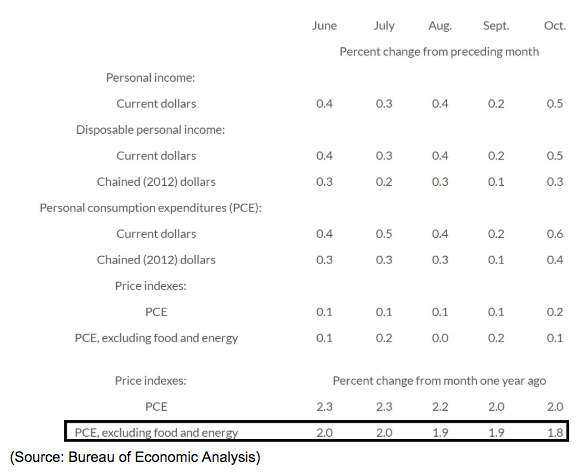
And in case the Fed doesn’t care what the bond market thinks, then its official inflation metric, core PCE is also beneath its target, and falling. That gives the Fed plenty of wiggle room to not just avoid hiking three times next year, but potentially pause after December’s hike (coming December 19th).
Is that single rate hike going to tip us into a recession? Not according to the four most important yield curves, which are the most accurate recession predictors ever discovered.
- 10y-3m: 0.46% (most accurate curve of all)
- 10y-1y: 0.2%
- 10y-2y: 0.16% (climbing in recent days)
- 30y-2y: 0.41% (unaffected by QE)
That’s not to say that the most important curve (10y-3m, which is what banks use to predict recessions and determine lending policy) won’t invert eventually.
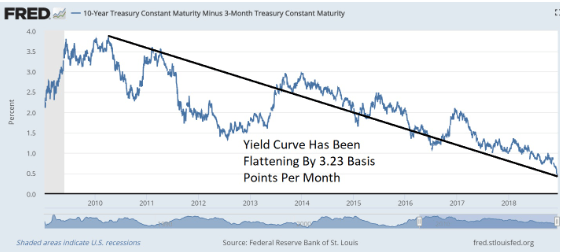
Since the Fed ended its QE program in October 2014 the 10y-3m curve has been flattening at a very stable rate that indicates this economic expansion won’t continue forever.
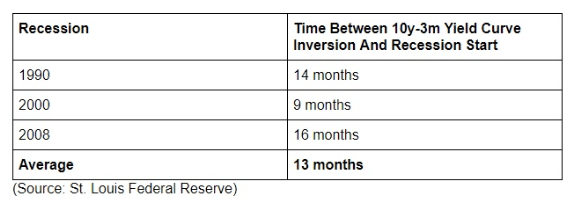
But at its current rate of decline, the best recession predictor known to man won’t turn negative (starting the recession clock ticking) until February 2020. Which historically speaking, means that an actual economic downturn would likely begin around March 2021. And guess what that means for the most likely start date for the next market top? It’s probably not coming until about mid-2020 based on the average lead time between yield curve inversions and when bear markets begin.
What will a bear market feel like? A lot different than this correction. According to Fisher investments:
“Pessimism usually runs rampant during corrections—but not early in bear markets. Bear markets usually start gradually, lulling investors into complacency. Often investors are still euphoric, having enjoyed years of strong returns, and choose to dismiss warning signs like an inverted 10-year minus 3-month Treasury yield curve or a negative trend in The Conference Board’s Leading Economic Indexes. Euphoria can be blinding. The gentle early declines don’t seem scary, creating a false sense of security. Deep pessimism typically doesn’t arrive until the bear market’s darkest days, which usually come in its final one-third or so (12 months in and when the economy is actually in a recession). By then, it is usually too late for investors to do anything about, lest they risk missing the rebound. But when a correction strikes, sentiment usually darkens quickly. Sometimes corrections start while investors are already scared of some perceived negative. Other times, they start for no apparent reason, triggering folks to seek causes—and then get scared of what they find. The volatility, on its own, can also be enough to send sentiment reeling.
The bottom line is that what we’re seeing now isn’t likely to be the start of so much as a “baby bear market” (20% to 25% non-recession peak decline) much less the 65% mega-crash that Hussman and his fellow perma-bears have been predicting for eight long years. Rather we’re likely getting close to capitulation, the point where investors, tired of three months (which is also the average duration of market declines for all corrections since 1965) of volatility sell and go to cash. Capitulation usually follows big, and rapid drops like what we’re now seeing.
Or to put another way, the worst December since 1931 for stocks isn’t likely a sign that we’re headed for a major crash, but that we’re likely racing to a final bottom for the market. A market that is likely still about 18 months away from peaking, meaning today is a terrible time to sell stocks in a blind panic.
Bottom Line: If You Want To Be A Good Long-Term Investor You Have To Be Good At Suffering Through Times Like These And Keep A Cool Head
The market is often irrational in the short-term. If it wasn’t valued, investors like Warren Buffet (and myself) would never have anything to buy. But when stocks cliff dive as they have been doing recently it’s extremely important for you to stay calm and ask yourself “does this price action make sense given the actual facts?”
Stocks have now declined to a point where the S&P 500’s valuation isn’t just reasonable, it’s undervalued. Meanwhile, 53% of individual S&P 500 companies are in a bear market, and even world-class companies are trading at fire-sale prices that imply near zero long-term growth.
When you see such a decline, one that is faster and stronger than any we’ve seen since the Great Depression, ask yourself how our economic and earnings fundamentals compare to 1931 (or 2008 when stocks actually went up 10% in December). Are we on the verge of a financial meltdown that threatens to plunge much of the S&P 500 into bankruptcy? Are earnings falling off a cliff? Is the economy shedding jobs by the truckload each month? Are wages crashing?
The answer to all of these questions is a firm “NO”. In reality, we’re facing slower but still POSITIVE growth. And with the market now undervalued, and both the Fed and Trump watching the market’s slide closely, the very risks we’re so worried about are actually shrinking.
Basically, stock prices must match the fundamentals in the long-term. And even in the short-term the more stocks become disconnected from economic and earnings reality, the shorter the downturn will be and the stronger the recovery from it. Or to put another way, the crazier, scarier, and more irrational the market plunge downward, the sooner it will end, and the sooner stocks will start their recovery to new record highs. How much of a rally might we see? I’ll leave you with this bullish fact. According to Fisher Investments, since 1926 the average 12-month rally from corrections lows has been 34% not including dividends.
About the Author: Adam Galas

Adam has spent years as a writer for The Motley Fool, Simply Safe Dividends, Seeking Alpha, and Dividend Sensei. His goal is to help people learn how to harness the power of dividend growth investing. Learn more about Adam’s background, along with links to his most recent articles. More...
9 "Must Own" Growth Stocks For 2019
Get Free Updates
Join thousands of investors who get the latest news, insights and top rated picks from StockNews.com!
Top Stories on StockNews.com

Best & Worst Performing Mega Cap Stocks for July 11, 2025
AEXAY leads the way today as the best performing mega cap stock, closing up 34.37%.
Best & Worst Performing Mega Cap Stocks for July 10, 2025
AEXAY leads the way today as the best performing mega cap stock, closing up 13.49%.
Best & Worst Performing Mega Cap Stocks for July 9, 2025
AEXAY leads the way today as the best performing mega cap stock, closing up 13.49%.
Best & Worst Performing Mega Cap Stocks for July 8, 2025
AEXAY leads the way today as the best performing mega cap stock, closing up 13.49%.