

December’s scary market crash (S&P 500 fell 17% during a three week period) was part of the worst correction in a decade (bottomed 19.8% from all-time high). That correction was mostly based on growing fears about a recession in 2019, which caused former Wall Street darlings like the tech-heavy Nasdaq to fall especially hard.
But fortunately for all of us, those recession fears have receded over the past few months, which is a big reason the market rallied 13.3% in Q1, compared to its historical Q1 rally since 1950 (according to S&P) of just 2.2%.
Perhaps nothing better exemplifies that lower recession risk than Q1’s GDP growth estimate of 3.2%, which came out last week. That initial reading (it will be revised twice in the next two months) was the best first quarter growth rate since 2013 and gives some investors hope that 2019’s economic growth rate might be much better than initially expected, perhaps even near 2018’s 2.9%, which was the strongest growth rate since 2005.
That in turn, some bulls hope, could allow corporate earnings growth this year to be strong enough to justify a continued strong rally in stocks. But before you breathe a sigh of relief about your portfolio, here are some very important things you need to know about what 2019’s current economic and market outlook.
Q1 GDP Growth Wasn’t As Good As The Headline Figure Indicates
At first glance, 3.2% growth in Q1 sounds amazing, since that quarter saw numerous headwinds that many worried could result in growth near zero. That includes the longest government shutdown in history and an ongoing trade war that has caused manufacturers to severely pull back on hiring (negative manufacturing jobs growth in the last two months).
And those risks are on top of natural cyclicality that typically sees the winter months post the weakest economic growth of the year, with following quarters seeing much stronger growth. But unfortunately for those hoping 2019 can match or even beat 2018’s 2.9% GDP growth, that’s likely not the case.
That’s because 1.7% of that 3.2% growth was due to cyclical one time factors including inventory buildup (accounted for just over 1%), an increase in government spending (due to the end of the shutdown) and a decrease in net imports (due to the trade war that’s likely to end soon). As Barron’s explains, factoring out these temporary benefits, real GDP growth was just 1.5%.
But while real GDP growth might not be as high as the headline figure shows, that doesn’t mean a recession is likely next year, nor that the current stock rally is necessarily doomed.
Growth For 2019 is Likely To Come in About 2%
The good news is that the rest of the year is still likely to stronger than many investors feared at the end of 2018. The bad news is that economists expect about 2% to 2.5% growth in the following three quarters.
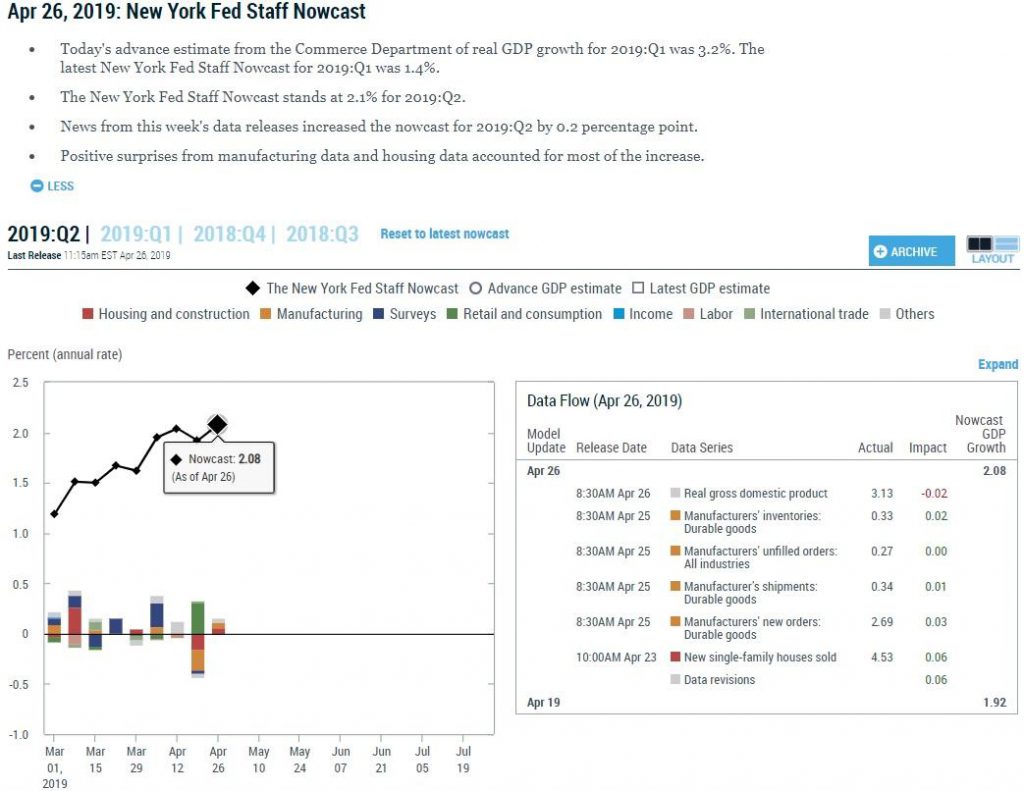
For example, the New York Fed’s real-time GDP growth model is estimating 2.1% growth in Q2. The reason I watch this estimate closely each week (it’s updated every Friday) is because the New York Fed is generally one of the most accurate growth forecasts. For example, its final Q1 estimate was 1.4%, which was nearly a perfect match for the real Q1 figure of 1.5%.
But for economic and investing bulls there are two bits of good news. First, as you can see in the above chart, Q2’s growth estimate has been rising steadily over the past six weeks, courtesy of stronger than expected economic reports. All models are based on the best available data, and it’s always possible that the macro reports continue to surprise to the upside.
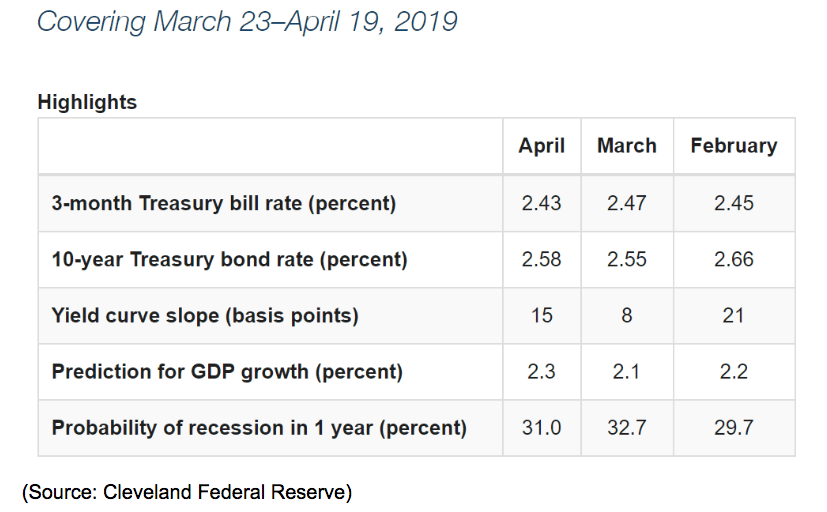
However, investing based on hope isn’t a great strategy so it’s better to err on the side of caution and just use the best data and models we have today. Another model I frequently use in managing my own retirement portfolio is the Cleveland Fed’s monthly recession risk/GDP growth estimate.
That’s based on the most accurate recession forecasting tool ever discovered the 10y-3m yield curve, which is what Dallas Fed bank lending officer surveys indicate is the primary recession prediction tool banks use to determine lending policies. The Cleveland Fed generally updates its model at the end of each month and as you can see, right now it’s expecting full-year 2019 growth of 2.3% (exactly what the overall Federal Reserve is expecting) and estimates the risk of a recession beginning by April 2020 to be 31%.
That also fits with what most economists are expecting (about 2% to 2.5% growth and 30% to 40% 12-month recession risk).
What does that mean for stocks? Most likely that we’re either going to trade relatively flat for the rest of the year or rise a bit more before experiencing one of the market’s frequent 5% to 9.9% pullbacks (which since WWII we have averaged one every six months).
The Stock Market Rally Might Not Die, but It’s Likely to Run Out Of Gas Soon
It’s important to remember that predicting what the market will do in any given 12 month period is all but impossible because in the short-term stock prices are almost entirely driven by sentiment, which tends to overwhelm the actual fundamentals.
I do my best to make probability-based guesstimates based on valuations, the macroeconomic outlook at the time, and analyst consensus of this year’s EPS growth for the S&P 500 (itself an educated guesstimate that changes frequently).
So here’s the good news for bulls and anyone whose’s worried about the constant doomsday prophecies (like from famous permabear John Hussman whose predicting a 65% market crash at the minimum).
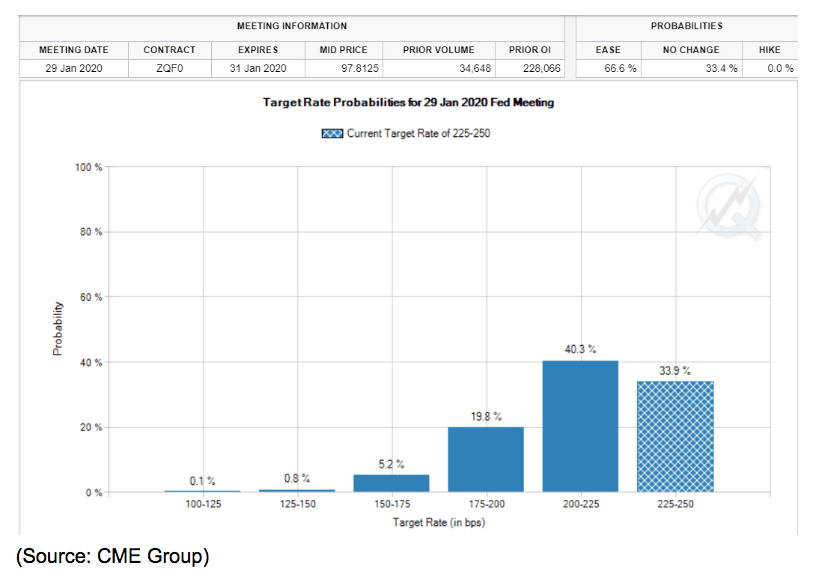
For good or ill, the market is obsessed with the Fed’s control over short-term interest rates by what it does with the Fed Funds rate. At the last Fed meeting, the FOMC confirmed it had zero plans for raising rates this year and would end its balance sheet roll off by September. And according to the bond futures market, where billions in interest rate hedges are made, the probability is 2:1 that we get a Fed Fund cut this year.
Now it’s important to keep in mind that the bond market, while considered by many analysts (including me) to represent the “smart money”, isn’t infallible. Those probabilities, just like treasury yields, fluctuate every day as economic data comes in and institutional bond investor sentiment about the economy and inflation expectations shifts.
The bond market estimating a 66% chance of the Fed cutting rates this year is actually a bearish call on the economy. That’s because if we get 2+% growth this year with inflation at current levels (in Q1 core inflation as tracked by the Federal Reserve was 1.3%, below the 2% long-term target) the Fed is simply going to leave rates alone for the foreseeable future. A rate cut this year is only likely if we’re seeing much weaker economic growth.
This is why most consider about 2% to 2.5% growth and 1.5% to 2% inflation to be the “Goldilocks zone” for stocks. Growth isn’t high enough to cause inflation to rise above levels that let the Fed keep short-term rates low and long-term rates (set by the bond market) similarly keeps 10 and 30 year yields (which are what corporate borrowing and 30 year mortgage rates are based on) at around 2.5% and 3%, respectively.
In effect, the Goldilocks zone is how it might be possible for the US economy to replicate the so-called “Australian miracle”, in which that country has gone 27 consecutive years without a recession (though GDP growth averaged about 1% for most of that time).
I personally root for just that kind of scenario because if we can achieve an Australian level period of two to three decades without a recession, but at roughly double the long-term growth rate, that is the best chance Mainstreet Americans have for finally recovering from the Great Recession (which devastated the labor market enough to result in a decade of subpar wage growth).
It also creates the ideal conditions for investors at least in terms of minimizing correction risk (which most people tend to hate).
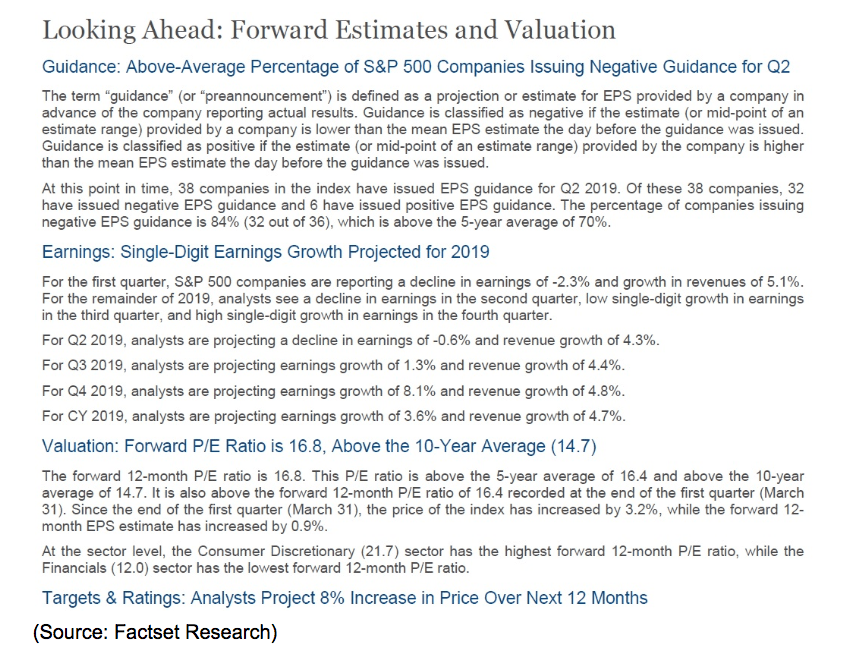
While 2019’s consensus EPS growth forecast is hardly impressive, currently at 3.6% according to Factset Research, the forward PE ratio of 16.8 is also only 4% above the 25-year average of 16.2. And since long-term interest rates are much lower today, it’s possible that stocks are fairly valued today. That’s the opinion of Jeff Miller, Seeking Alpha’s economic guru, and another trusted analyst I follow to keep track of the big picture on the US economy.
Why do analysts currently expect the S&P 500 to go up 8% over the next 12 months? Most likely for three reasons. First, valuations might be at fair value, if you adjust for interest rates.
Second, the market’s historical total return since 1871 is 9.1% CAGR, and since 1926 the S&P 500 has gone up 74% of the time, on a full year basis. Thus forecasting a roughly 8% to 10% 12-month market return isn’t rocket science, but merely making a low-risk/high probability statement.
Finally, the consensus for 2020 earnings growth is currently 11.4%, which might not just justify an 8% rally through April 2020, but might even cause the forward PE ratio to contract back to its historical norm.
I don’t personally believe that 2020 double-digit growth projection, and here’s why.
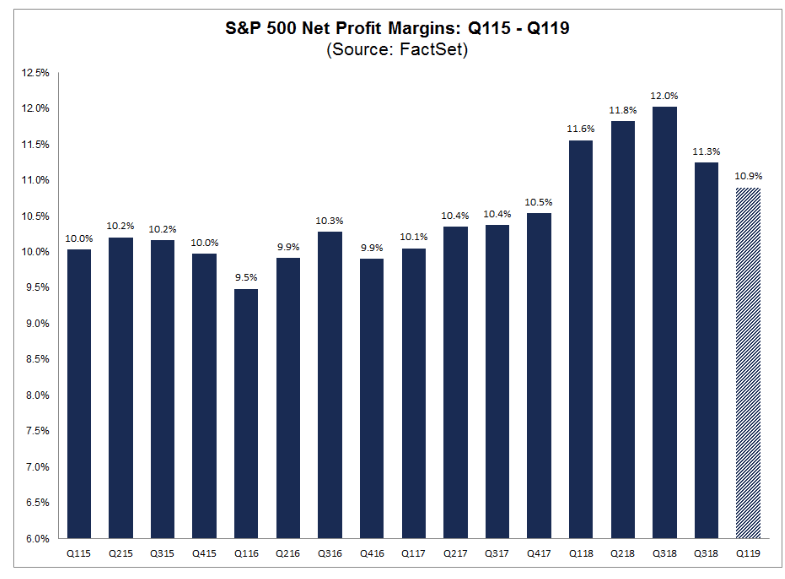
Tax cuts helped fuel drive profit margins for corporate America to 12% in Q3 2018, the highest level in US history. They’ve now been falling for two consecutive quarters and are expected to continue falling for two more, according to Factset Research.
Before tax cuts the S&P 500’s net margin was roughly stable at about 10%. I expect that tax cuts, while a permanent boost to profitability, will largely be offsetting continued slow but steady growth in wages, as the labor market tightens.
The good news is that the fastest wage growth we’ve seen so far was two months ago, when the Bureau of Labor Statistics reported 3.4% average wage growth (hourly wages, YOY basis) and 3.5% for non-supervisory workers (80% of America).
Historically non-recessionary times see 3.5% to 4% average wage growth, meaning that even the fastest wage growth we’ve seen in a decade is merely the low end of normal. Fed Chairman Jerome Powell has explicitly said that he’s not worried about current wage growth and the Fed’s latest meeting minutes back that up, which is why the FOMC is planning no more rate hikes this year.
If we can continue growing 2% to 2.5% annually for several more years, and generate over 150,000 monthly net jobs, the labor market will keep tightening and wage growth might float up to about 4.0%, with modest inflation of 2% meaning 2% real wage growth, the highest level since 2007.
Remember consumer spending accounts for about 70% of GDP growth, and is ultimately what drives corporate earnings growth and thus the stock market. If you’re a fan of the longest bull market in history (as I certainly am), then you want the goldilocks conditions to continue for as long as possible.
Bottom Line: Recession Risks Continue to Decline, But Don’t Expect Q1 Level Rally To Continue All Year
Don’t get me wrong, no one loves to see the economic fundamentals beat expectations more than me. I NEVER root for a recession or bear market, even if that’s precisely when the best stock deals can be found and the highest long-term returns achieved.
But the truth is that Q1’s blowout 3.2% first estimate is not nearly as strong a market rally catalyst as some investors hope. Not just could it be revised down significantly in the coming two months, but the large increase in government spending (due to the end of the shutdown) and high inventory adjustment means that the growth rate for the rest of the year is likely to be far lower, about 2% to 2.5%, in line with what we’ve seen since the Great Recession ended.
The good news is that’s still strong enough growth to keep us in “the Goldilocks zone” meaning strong job creation, low inflation, and historically low-interest rates. That’s a great environment for stocks in general, but the bad news is that, given how 2019 earnings growth expectations are shaping up, it’s not likely to allow for the market rally to maintain its torrid Q1 rate.
Stocks aren’t necessarily so overvalued that a correction is probable this year, but a pullback of 5% to 9.9% is certainly possible (and historically likely). What’s an investor to do in such a macro/earnings/valuation environment?
My advice is stick to your long-term investing plan meaning
- Make sure your asset allocation (mix of cash/stocks/bonds) is right for your needs
- Make sure the stock portion of your portfolio is well diversified into high-quality companies (such as blue-chip dividend stocks)
- Put new money to work into the best opportunities (like the best dividend stocks to buy in May)
About the Author: Adam Galas

Adam has spent years as a writer for The Motley Fool, Simply Safe Dividends, Seeking Alpha, and Dividend Sensei. His goal is to help people learn how to harness the power of dividend growth investing. Learn more about Adam’s background, along with links to his most recent articles. More...
9 "Must Own" Growth Stocks For 2019
Get Free Updates
Join thousands of investors who get the latest news, insights and top rated picks from StockNews.com!
Top Stories on StockNews.com

Best & Worst Performing Mega Cap Stocks for July 11, 2025
AEXAY leads the way today as the best performing mega cap stock, closing up 34.37%.
Best & Worst Performing Mega Cap Stocks for July 10, 2025
AEXAY leads the way today as the best performing mega cap stock, closing up 13.49%.
Best & Worst Performing Mega Cap Stocks for July 9, 2025
AEXAY leads the way today as the best performing mega cap stock, closing up 13.49%.
Best & Worst Performing Mega Cap Stocks for July 8, 2025
AEXAY leads the way today as the best performing mega cap stock, closing up 13.49%.