

Many silver traders are pulling out their proverbial hair over silver’s inability to pick a direction. Not that silver traders probably have much hair left at this point… (Supposed to be a joke, and full disclosure: your friendly Gold Enthusiast is balding!)
Let’s take an unbiased look at the daily chart for US silver as shown by SLV, the popular unleveraged trading ETF.
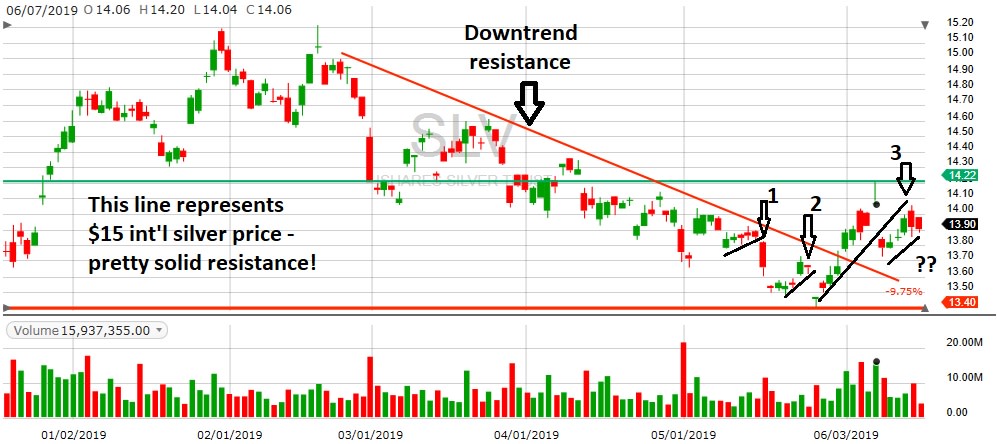
(credit Fidelity.com)
This is a pretty busy chart at the moment, so let’s take the notes step by step, starting at the left. First we’ve drawn in a “$15/oz USD equivalent” price line. You can see how that’s acting as major overhead resistance right now – it was confirmed on June 7.
Next comes the downward-sloping resistance line for the past 3+ months of downtrend in silver prices. We all know that for prices to go up they have to go up, which especially means they have to break any pesky longer-term downtrend resistance lines. Otherwise, any attempt to say prices are going up are met with scorn and derision, because, well, you’d be wrong.
Then we get to the recent market. Your friendly Gold Enthusiast describes these in very technical terms as “frustrating times”. Because every time we want to get optimistic, we’re stymied by that darn sloping downtrend line. Attempts #1 and 2 didn’t succeed in breaking out, being met instead by a sudden drop right at the resistance line.
Almost like someone was gaming the market… but that’s a topic for another day.
Then comes Attempt #3, which blew right through the downward resistance line and flew right on up to overhead resistance. Then it had a sudden drop. But it still stayed above the downward resistance line, which turns that into a downward sloping support line. Not much better – we want to see at least a flat support line! – but we’ll take it.
Now we’re in Attempt #4 in the lower right corner, labelled quite creatively as ??. Because we don’t know if the current attempt will get all the way back up to overhead resistance.
All these little pop & drop’s are insanely frustrating to trade. Because you don’t know when to get out of a trade! Getting in is relatively easy – buy right after a drop. But then you don’t know when the next drop is coming, and when it does it wipes out all of your gains and then some.
Plus there’s the frustration of trying to eke out a profit in a market that’s essentially stop-starting. All the jerking around plays havoc with the psyche. So if you’re on the train at the end of the day next to a trader who seems slightly incoherent, have some pity. The poor bloke is probably mentally exhausted trying to make sense of a nutty situation.
Why is silver doing this? Well, the correct answer is probably closely related to all the currency manipulation going on. In Europe the ECB is seen as parading it’s “policy weapons” while the US Fed is trying to decide whether to goose the market sooner rather than later. The interesting bit there is that they apparently aren’t fond of the whole free-market idea anymore, it’s all about when to push on which pedal, especially currency-related pedals. Which creates havoc for precious metals – Are they doing this because the economy is really that bad? Or because they’ve simply become power-crazed lunatics, convinced they are smarter than thousands of years of historical evidence that gov’t interventions blow up markets?
This is why we like to wait for more sane periods to trade. Fortunately for now it looks like the Fed won’t lower interest rates now, which should give a slight boost to metal prices. But come the next Fed meeting in July we might see metals prices drop thanks to an expected interest rate cut. Sigh, more zombies on the train…
Written by The Gold Enthusiast
DISCLAIMER: The author is long the silver sector via small positions in PAAS and SVBL, with no intentions of trading these in the next 48 hours.
About the Author: Mike Hammer

For 30-plus years, Mike Hammer has been an ardent follower, and often-times trader, of gold and silver. With his own money, he began trading in ‘86 and has seen the market at its highest highs and lowest lows, which includes the Black Monday Crash in ‘87, the Crash of ‘08, and the Flash Crash of 2010. Throughout all of this, he’s been on the great side of winning, and sometimes, the hard side of losing. For the past eight years, he’s mentored others about the fine art of trading stocks and ETFs at the Adam Mesh Trading Group More...
9 "Must Own" Growth Stocks For 2019
Get Free Updates
Join thousands of investors who get the latest news, insights and top rated picks from StockNews.com!
Top Stories on StockNews.com

Best & Worst Performing Mega Cap Stocks for July 11, 2025
AEXAY leads the way today as the best performing mega cap stock, closing up 34.37%.
Best & Worst Performing Mega Cap Stocks for July 10, 2025
AEXAY leads the way today as the best performing mega cap stock, closing up 13.49%.
Best & Worst Performing Mega Cap Stocks for July 9, 2025
AEXAY leads the way today as the best performing mega cap stock, closing up 13.49%.
Best & Worst Performing Mega Cap Stocks for July 8, 2025
AEXAY leads the way today as the best performing mega cap stock, closing up 13.49%.