

In 2018, the S&P 500 closed down about 5% for the year, the worst performance in a decade (and with two corrections that year). So it’s understandable why the market’s 20% YTD rally has so many investors smiling.
There’s good news for those counting on stocks to keep climbing their wall of worry. Some analysts are predicting big gains in the coming months, including one that thinks the S&P 500 could end the year at a record 3,500 (15% rally over the next 4.5 months).
Let’s take a look at why that call MIGHT be plausible, what it would take for it to become a reality, and most importantly, what’s the right and wrong way for smart investors to play such a potential market melt up.
This Analyst Thinks S&P 3,500 Is Possible by Year-End
On July 12th Hillary Cramer, of Kramer Capital Research told Reuters that she thinks the market might finish the year at 3,500, a 15% rally from today’s record highs. Her bullish call was based on a continuation of the current TINA (there is no alternative) rate cut euphoria rally lasting the rest of the year.
Now I’m very skeptical of such calls, and ignore all 12-month price targets, because in the short-term sentiment, not fundamentals, tends to dominate Wall Street. But in this case, I can see how a 15% rally from here leading to a 40% gain for the market this year, might happen.
Why the S&P Finishing the Year at 3,500 Is Possible
The current rate cut/TINA rally is based on a very delicate set of conditions that the media has dubbed “the goldilocks economy”.
- US growth is slowing BUT not threatening recession
- Global growth is slowing BUT not threatening recession
- US growth is slowing less acutely than other developed countries (like Japan and Europe), causing the dollar to remain strong and capping inflation (despite tariffs)
- The Fed, freed from inflation fears, has indicated (including last week when Powell testified before Congress) that at least one or two rate cuts this year are all but certain (insurance against a recession).
- Corporate earnings growth estimates have steadily fallen (about 7.6% so far this year) BUT continue to be positive for 2019 and very strong for 2020 (11.1% according to FactSet Research)
- Historically 70% of S&P 500 companies beat earnings expectations (on average by 4%) turning earnings season (July and August) into a short-term positive catalyst
- Buybacks from large-cap companies have caused the three major indexes (market-cap-weighted) to keep rising despite steadily retail investor withdrawals from US equity funds
- Latest fund flow data from Lipper Financial indicates this MIGHT be reversing (retail investors are starting to buy the rate cut rally)
- President Trump, eager for a “big win” might accept a deal he doesn’t actually like, that ends the Trade War in late 2019 (triggering an “everyone back into the pool” rally).
Am I saying that such a melt-up is likely? No. It requires a perfect alignment of the above factors for a 2017 style, super low volatility steady grind higher month after month. This is NOT my base case assumption, but rather a plausible way that the S&P 500 might hit 3,500 by the end of the year.
But if it happens, there is a right and wrong way to play such a melt-up, which is why I’m writing this article.
The Smart and Stupid Way to Play a Market Meltup
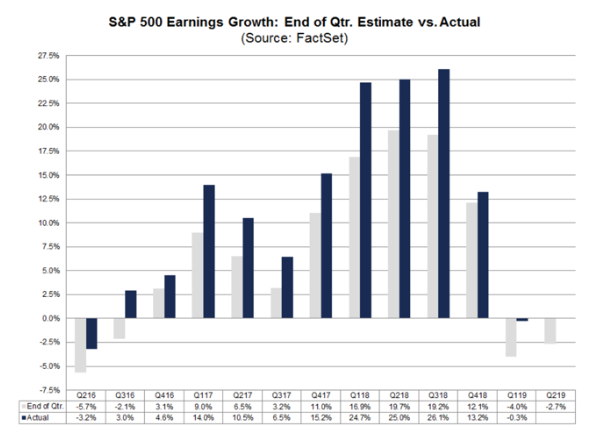
As you can see Wall Street analysts like to play a game, in which 2-year EPS forecasts are steadily revised down each quarter allowing about 70% of companies to easily beat low ball expectations.
This is why FactSet Research, going off the 5-year average earnings beats, actually thinks EPS growth in Q2 2019 will be 1%, not -3% as analysts expected, going into earnings season.
As long as companies aren’t too bearish with guidance (sandbagging so they can beat later) this could create a short-term catalyst in July and August to slowly drift stocks higher (wild card is Trump trade war tweets).
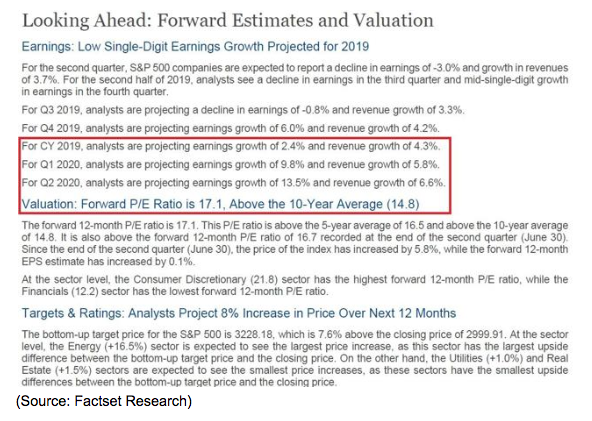
But while analysts are bullish (8% 12-month rally projected vs Kramer’s 15% 4.5 month one) I want to point out one troubling fact. The already slightly elevated 17.1 forward PE (baking in $176 in S&P 500 EPS) is based on some rather bullish forecasts including 10% and 14% EPS growth in Q1 and Q2 2020, respectively (plus 6% growth in Q4).
I don’t consider those growth estimates reasonable except if we get a trade deal soon (by the end of the year). In other words, if we get a trade deal (far from certain given China’s insistence that a deal ends all tariffs immediately) then the market’s current valuation is only modestly higher than the 25-year average of 16.2 forward earnings.
This means that any trade deal bump the market sees will not be justified because it’s already priced in (and then some). If a trade deal isn’t reached then 2020 expectations will come down a lot (as 2019’s have all year long) causing the forward PE to rise steadily even if the market stays flat.
What about rate cuts making current valuations reasonable? In theory that could happen. Since 2000 the average earnings yield risk premium (earnings yield minus 10-year yield) has been 4%.
For Hillary Kramer’s 3,500 call to occur would require about 19.5 to 20X forward warnings (January 2018 peak was 18.5). Theoretically, if 10-year yields (which the Fed can only control if it buys lots of US bonds) hit 1% (vs 1.36% all-time low post-Brexit vote) 20 times forward multiple on the S&P 500 becomes “reasonable”.
But it’s important to remember that the TINA theory of stock/bond equivalence (if rates are low enough bond investors have no choice but to buy stocks instead) is VERY dangerous.
Like in physics, where the laws of the universe are constant and immutable, at the extremes things tend to break down. In the infinite gravity well of a black hole, physicists say they don’t know what actually happens, but assume that crazy stuff occurs.
The same is true at extremely low interest rates that make investors foolishly think stocks are a bond alternative (other than paying income stocks and bonds are NOTHING alike).
For example, assume that the Fed buys enough bonds to drive 10-year yields to zero (as they are in Japan and Europe). In that case, a 4% earnings yield risk premium equates to a forward PE on the S&P 500 of 25.0 being “justified”. For context, the tech bubble peak forward PE (the most overvalued US stocks have ever been) was 27.2. At -35% on the 10-year a 100X forward PE is “reasonable” and at -3.9% stocks could, theoretically, trade at 1000 times earnings (some tech names could trade at 2,000).
As long as all conditions that caused such a rally hold forever, stocks can remain permanently overvalued due to the world being awash in “free money” that has to go somewhere.
But if anything changes, such as economic growth picking up even a little, and inflation expectations (currently 1.6% for the next 30 years according to bond futures), tick up a smidge, then the party can reverse in a hurry.
For example, on July 8th economic data (weekly job losses and inflation reports) came in SLIGHTLY above expectations. 10-year yields jumped 10 basis points (a huge move for bonds). The result was some high-yield “bond alternatives” like REITs crashed 3% or even 4% in a day. No change in fundamentals for the companies, but overvalued stocks owned incorrectly by yield-chasers still suffered.
In January 2018 we got a perfect example of why TINA is so dangerous. At the time the S&P 500 had gone up 14 consecutive months, and the biggest market decline in 2017 from all-time highs was 3%. Volatility (per the VIX) was at the lowest level in over 50 years.
Investors were complacent and in early January 2018 tax cut euphoria created a TINA/FOMO (fear of missing out) melt-up. One in which even bears that admitted stocks were at crazy valuations, but you still had to buy them because the crazy rally was likely to continue.
The CNN Fear/Greed Index, a composite of 7 technical indicators (such as volatility, junk bond demand, and put option demand) hit 85, one of the highest levels ever. With the market’s forward PE at 18.5, it was obvious that ANY modest changes to the perfect storm of factors driving that bubble would cause it to pop.
A “hot” jobs report that showed wage growth at the strongest levels since 2008, caused inflation expectations to jump a bit. Bond yields took off and the S&P 500 suffered one of the fastest corrections in history (10% in 10 days).
That’s the thing to always keep in mind about melt-ups and TINA/FOMO rallies. While you can’t know the exact day the market might top and how fast it might correct, you can use historical average valuations, the overall economic/earnings outlook, and broad sentiment gauges, to get a rough idea of when a top is close when you hit such extreme levels.
If we hit 3,500 on the S&P 500 this year, then we will definitely be in such a bubble. How might investors know that we’re in such a bubble? Here’s what Milton Berg, founder of Milton Berg advisors recently told Marketwatch.
“We have a list of more than 100 indicators that we match to previous market peaks and of all these 100 only two are inconsistent with levels seen at market peaks.” – Milton Berg
Berg says that the two remaining confirmers of a market top are that investors have NOT been piling into bonds ($25 billion in negative fund flows in June). If that reverses and bond yields crash (likely causing stocks to soar), then the stage will be set for a market top and correction to occur.
By the way, Berg’s model nailed the 1987 “Black Monday” 23% single-day crash to the day. That was almost certainly luck but the point is that investors have to realize that this crazy rate cut rally is not backed by fundamentals, but merely short-term “rates are all that matters” foolishness.
So what’s a smart investor to do to enjoy this rally but not do something stupid with their hard-earned money? I offer some sound advice in my conclusion.
Bottom Line: If We Get a Melt-up Enjoy the Sugar Rush Rally…Just Remember That TINA Always Ends in Tears
I’m not a market timer, since John Bogle, founder of Vanguard famously said that in 50 years of experience in the industry, he’d never met anyone that had met anyone who could do it well.
Logical cases can be made for the market pulling back or melting up in a 2017 style low volatility, rate cut euphoria induced TINA/FOMO rally. But I’d remind investors that, despite what the last few weeks (and financial media) might have you believe stocks ARE NOT bonds.
Today the market is precariously balanced on a knife’s edge of “goldilocks” perfection. Global growth is slowing but not threatening recession. US growth is slowing but less so than other developed countries (a strong dollar is keeping a lid on inflation). The Fed, worried about global growth and the US/China trade war, is being very dovish and likely to cut interest rates twice or perhaps even three times.
Corporate earnings are likely to be up modestly this year, allowing the decade long buyback binge to possibly continue driving large-cap stocks (and thus the three big indexes) steadily higher levels.
And finally, as with all TINA/FOMO rallies, retail investors, thus far skeptical of the rally (for good reason) might decide they don’t want to miss out on the “glorious” low volatility clockwork-like gains the market might produce in June, July and August.
IF all these stars align, then a 2017 style melt-up could happen, driving that 40% 2019 gain prediction for the S&P 500. But I’d remind you that the market’s forward valuation is not just slightly rich by historical standards, but already pricing in a late 2019 trade deal that ends the US/China trade war once and for all.
This means that the reward/risk ratio is getting steadily worse, and if anything were to go wrong with our “goldilocks” like conditions, stocks could be in for a sharp decline (such as in May 2019 or December 2018).
So the best way for smart investors to “play” the possible melt-up is by sticking to their long-term plans, rebalancing their portfolios (trim stocks if you’re overweight equities), and avoiding the temptation to chase recent performance. If you lost sleep in December 2018 or May 2019, then your stock allocation is too high and short-term bonds (cash equivalents) are a good place to put stock gains.
For new money, I recommend adjusting your monthly buys to factor in the current risk factors and valuations. This might mean overweighting new savings into cash (such as the ETF MINT) if valuations get even more extreme and if your preferred strategy is buying broader market ETFs (like SPY or VOO).
If you like passive investing then consider putting new money to work in undervalued sectors like financials and energy (which will likely do well if we avoid a 2020 recession).
If you like buying individual companies (as I do), then focus on the most undervalued quality companies (something great is always on sale). Just because the market is being stupid and euphorically ignoring risks, doesn’t mean you have to.
Strive to follow Charlie Munger’s advice and consistently make “not stupid decisions” rather than try to be greedy and take on too much risk during a potential TINA/FOMO rally. As I like to say, TINA is the devil, a silver-tongued serpent that will tell you what you want to here and make you feel good in the short-term. But listening to her will ultimately end in tears, because rate cut rallies that ignore fundamentals create bubbles that lead to February 2018 style (10% decline in 10 days) corrections.
About the Author: Adam Galas

Adam has spent years as a writer for The Motley Fool, Simply Safe Dividends, Seeking Alpha, and Dividend Sensei. His goal is to help people learn how to harness the power of dividend growth investing. Learn more about Adam’s background, along with links to his most recent articles. More...
9 "Must Own" Growth Stocks For 2019
Get Free Updates
Join thousands of investors who get the latest news, insights and top rated picks from StockNews.com!
Top Stories on StockNews.com

Best & Worst Performing Mega Cap Stocks for July 10, 2025
AEXAY leads the way today as the best performing mega cap stock, closing up 13.49%.
Best & Worst Performing Mega Cap Stocks for July 9, 2025
AEXAY leads the way today as the best performing mega cap stock, closing up 13.49%.
Best & Worst Performing Mega Cap Stocks for July 8, 2025
AEXAY leads the way today as the best performing mega cap stock, closing up 13.49%.
Best & Worst Performing Mega Cap Stocks for July 7, 2025
AEXAY leads the way today as the best performing mega cap stock, closing up 13.49%.