

I think we can all agree that few economic reports are more closely watched, or have more market-moving power than the monthly jobs report. That’s because the health of the US labor market is crucial to wage growth and the health of consumer spending, which drives almost 70% of US economic growth.
February’s jobs report was shockingly bad, which only added to the worry many investors have about a recession possibly looming in 2020. Well, there’s good news and bad news about the next report, which is likely to be the most important in a decade.
Find out why, and more importantly (for your portfolio), why the results might determine whether stocks spend the next year or so rising, or declining into a bear market.
Why the March Job Report Is the Most Important In a Decade…
In 2018 we averaged 223,000 net jobs created per month, which nine years into an economic expansion is excellent. In December and January we actually beat those figures, but then in February job creation appears to have fallen off a cliff.
The Bureau of Labor Statistics first estimate for February job creation was 20,000, 90% below the 185,000 economist consensus. While the margin of error for this estimate (which will be revised over the next two reports) is about 150,000 that’s still a shockingly bad number.
That’s because, according to the Wall Street Journal, we need 145,000 net new jobs each month to keep up with population growth and thus keep unemployment constant. The steadily tightening labor market is the reason that average hourly wage growth (also reported in each jobs report) grew 3.4% YOY in February, and 3.5% for non-supervisory workers, who account for 80% of the labor force.
Rising wages and continued weak inflation means real wages are growing at their fastest rate in years (last month’s wage growth was the best since 2007). That, in turn, has kept consumer confidence high, which has been powering retail sales growth over 5% to 6% in most recent months.
But after 101 straight months of job gains (the longest streak in US history), many fear that February’s weak numbers indicate the strongest labor market in 20 years might be running out of gas.
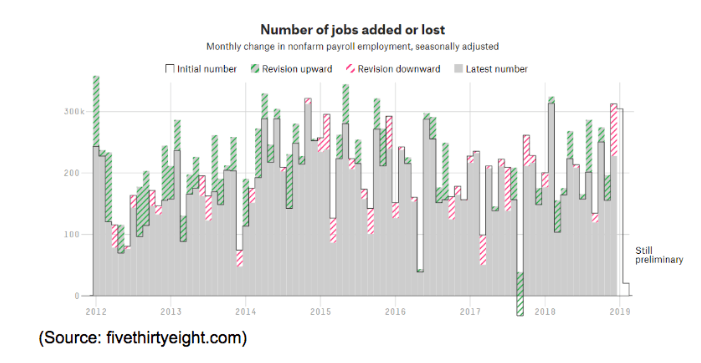
That’s because the final revisions made in the next two reports might potentially show negative jobs growth in February, and if March’s figures indicate the start of a trend in falling jobs, consumer confidence (and spending) could be shattered.
There is already some troubling evidence that wage growth, which has been trending in the right direction for about eight years, might be cooling.
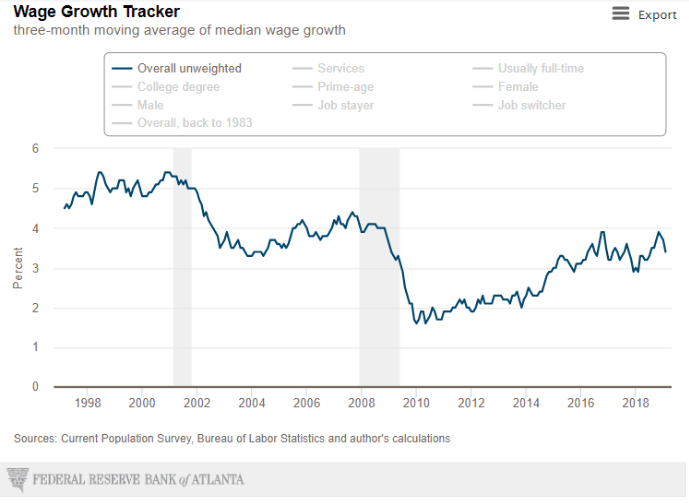
The Atlanta Fed’s 3 month rolling average of median wage growth, which factors out 10,000 retiring baby boomers per day, is a more accurate representation of actual wage growth. And while the average hourly wage the BLS reports each month has been steadily rising all year, the median wage growth rate peaked in December at 3.9% and has fallen for three straight months to 3.4% in February.
If the March report shows a significant upward revision to February’s estimate, and a strong initial reading (above 200K) then we’re likely to see wages (no matter how you measure them) continue trending higher due to ongoing consumer and business confidence, fueled by strong wage growth and good spending.
But if we see a downward revision and or a negative estimate for March? Well, then it might signal that businesses are cutting back on hiring, which is a major warning signal of a possible recession coming next year.
Fortunately for long-term investors (and America in general), there is evidence that the February report might have been a fluke and that March’s figures (coming April 5th) will give investors reason to cheer. On Monday, April 1st, we got two great bits of economic news.
The first was The Institute for Supply Management or ISM’s index of national factory activity rising to 55.3 from 54.2 in February. A reading of 50 represents zero growth and 55.3 is a solid reading pointing to continued strong manufacturing expansion (the part of the economy that’s been especially strong in recent years but falling hard in recent months).
The other good news was construction spending growing at the fastest rate in nine months. Economists polled by Reuters were expecting -0.2% growth but it came in at 1%, after 2.5% growth in January.
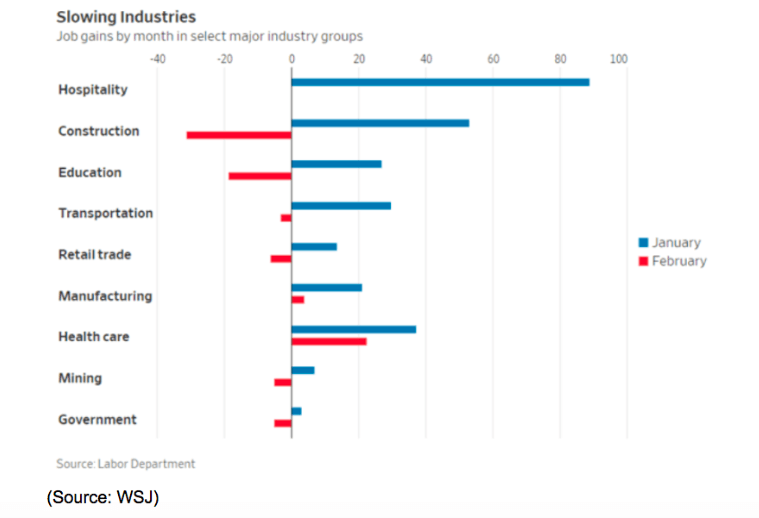
As you can see a sharp contraction in construction jobs was a main driver of February’s horrible numbers, which is a big reason that the yield curve, the best recession predictor in history, inverted recently (more on this in a moment) inverted last week. That, in turn, sent the S&P 500, Dow Jones Industrial Average, and Nasdaq cratering on Friday, March 22nd (by as much as 2.5%).
I’m always a long-term bull on the US economy and always root for the short-term outlook to be as strong as possible. After several months of steadily deteriorating economic fundamentals, these two reports give me optimism that we may be stabilizing at slower growth in 2019, but positive growth that might keep us out of a recession, and job creation strong enough to continue driving stronger wage growth.
But that bullishness is going to be tested on Friday when the March jobs report could either tip the economic outlook either towards low 2020 recession risk…or send it soaring to the highest levels since 2007.
And for investors that means Friday’s report could plunge us into stock market hell…or set the stage for a continuation of 2019’s impressive rally (best Q1 since 2009).
…And Might Determine What Stocks Do for the Next 12 to 18 Months
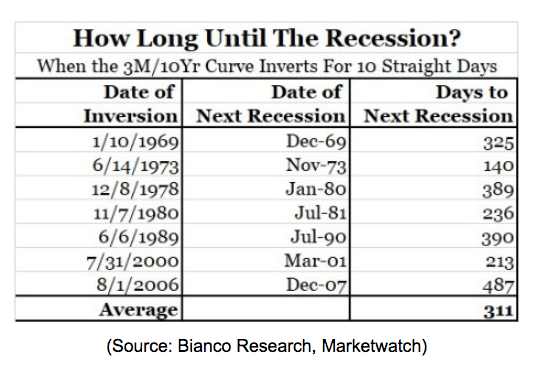
The reason the stock market reacted so violently to the downside on March 22nd is that the 10y-3m yield curve inverted for the first time since 2007. According to the San Francisco Federal Reserve, this yield curve is the most accurate recession forecaster ever discovered. According to a study by the Cleveland Fed, since 1966 inversions have been followed by recessions 89% of the time.
But before you panic, realize two things.
First, the reason that the yield curve is important at all (and a proven leading economic indicator) is that, according to a Dallas Fed survey of bank lending officers “a prolonged and moderate inversion” leads to banks reducing credit to both consumers and businesses (because they expect a recession soon). In other words, if the yield curve falls negative enough and stays negative, then banks will cut the money supply and cause the very recession they are worried about.
Since 1969 a good rule of thumb for starting the three to 16-month recession clock is the curve closing negative for 10 straight days. While 7 data points aren’t statistically significant, the fact is that over the past 49 years such an event has failed to be followed by a recession (and bear market) within 16 months.
The yield curve spent most of last week falling
- March 22nd: -1 basis point (what caused the market freakout)
- March 25th: -3 bp
- March 26th: -5 bp
- March 27th: -6 bp (-9 intraday)
- March 28th: -5 bp (5 straight days negative)
- March 29th: +0.4 bp (10 day confirmation clock resets)
Fortunately some better than expected global economic news on Friday, March 29th caused the curve to pop and close positive, canceling the 10-day confirmation countdown.
As I write this the yield curve is at 9 basis points, which is up from 0.4 on Friday, and as low as -9 bp intraday last week. That major surge in the yield curve, caused by long-term yields soaring much faster than short-term ones, is a sign of bond investors (who are focused almost entirely on risk and capital preservation vs the stock market’s focus on riskier capital gains) are getting a lot more bullish on the economy.
The likely reason for that is the two positive reports I mentioned above, plus better than expected economic data out of China plus continued positive talk out of both Beijing and DC about the US/China trade negotiations.
If Friday’s report comes in better than expected (and it’s a pretty low bar to clear at this point) then the yield curve might continue its upward trend and give us a nice bit of safety buffer (like rising to 25 bp). On the flip side, if the report shows a negative reading in February and an even larger negative one in March? Then the curve might fall off a cliff and invert that day (resulting in stocks potentially falling 2% to 3%).
More importantly, the apparent breaking of the single most bullish evidence of economic growth in years could keep the curve headed steadily negative for several weeks. Long enough not just to trigger that three to 16-month countdown but cause banks to actually pull back on lending and cause the downturn so many are worried about.
In contrast, a much higher yield curve, in concert with a trade deal arriving in April or May, a clear path for the stock market to end the year strong. That’s indeed what analysts expect to happen, with the consensus estimate being for a 10% rally in the S&P 500 over the next 12 months.
Mind you, with the stock market at historical fair value (based on forward PE) and stocks rising 74% of any 12 month period (by about 10%), that is a high probability forecast. But one that might be supported by the fundamentals if the job market remains strong and we can avoid a recession in 2020 (when a trade deal and stronger consumer spending) is expected to drive 11.6% EPS growth for the S&P 500.
Bottom Line: A Strong Labor Market Is the Best Chance We Have of Avoiding a Recession And Bear Market
Over the past two years, the strongest evidence that the Great Recession might finally be fading into history was the steadily tightening labor market driving a beautiful rise in wage growth.
February’s shockingly bad numbers threatened to break the longest consecutive streak of positive job creation in history, with confirmation coming in the March and April jobs reports. A negative report would likely signal wage growth has peaked and could begin steadily declining as negative job growth causes unemployment to rise, consumer and business sentiment to fall, and makes a 2020 recession a high probability event.
On the other hand, a positive report, with strong March job creation and an upward revision of February’s estimate, could mean that the economy is stabilizing at a slower but still positive growth rate. One that clears the way for stocks to maintain or even add to this year’s already impressive gains.
About the Author: Adam Galas

Adam has spent years as a writer for The Motley Fool, Simply Safe Dividends, Seeking Alpha, and Dividend Sensei. His goal is to help people learn how to harness the power of dividend growth investing. Learn more about Adam’s background, along with links to his most recent articles. More...
9 "Must Own" Growth Stocks For 2019
Get Free Updates
Join thousands of investors who get the latest news, insights and top rated picks from StockNews.com!
Top Stories on StockNews.com

Best & Worst Performing Mega Cap Stocks for July 9, 2025
AEXAY leads the way today as the best performing mega cap stock, closing up 13.49%.
Best & Worst Performing Mega Cap Stocks for July 8, 2025
AEXAY leads the way today as the best performing mega cap stock, closing up 13.49%.
Best & Worst Performing Mega Cap Stocks for July 7, 2025
AEXAY leads the way today as the best performing mega cap stock, closing up 13.49%.
Best & Worst Performing Mega Cap Stocks for July 4, 2025
AEXAY leads the way today as the best performing mega cap stock, closing up 13.49%.