

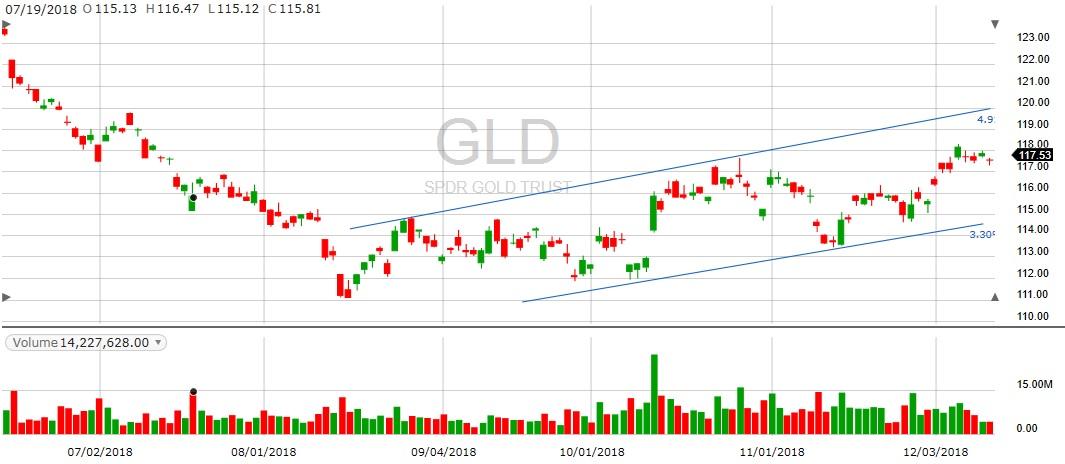
Gold bugs have been all a-twitter lately, what with gold finally seeming to rise from the dead. But is their excitement warranted? Let’s see what the charts say. Here’s the six-month chart of GLD and a few lines showing the current trading channel.
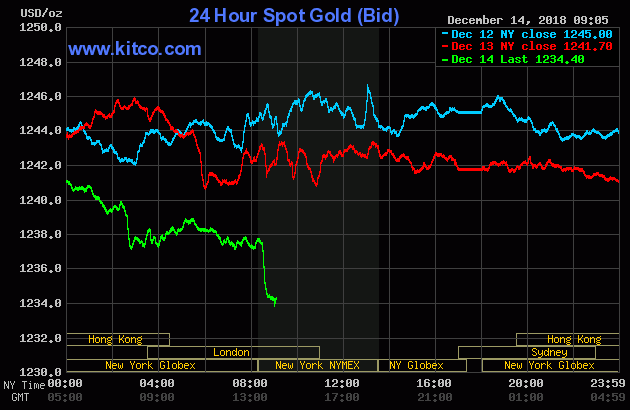
Let’s look at the “today” chart for early action as the New York market opened this morning (Dec 14, 2018)
But one thing is for sure — we are closer to the time when gold either breaks up-and-out or down-and-splash. We’ll be watching!
About the Author: Mike Hammer

For 30-plus years, Mike Hammer has been an ardent follower, and often-times trader, of gold and silver. With his own money, he began trading in ‘86 and has seen the market at its highest highs and lowest lows, which includes the Black Monday Crash in ‘87, the Crash of ‘08, and the Flash Crash of 2010. Throughout all of this, he’s been on the great side of winning, and sometimes, the hard side of losing. For the past eight years, he’s mentored others about the fine art of trading stocks and ETFs at the Adam Mesh Trading Group More...
9 "Must Own" Growth Stocks For 2019
Get Free Updates
Join thousands of investors who get the latest news, insights and top rated picks from StockNews.com!
Top Stories on StockNews.com

Best & Worst Performing Mega Cap Stocks for July 11, 2025
AEXAY leads the way today as the best performing mega cap stock, closing up 34.37%.
Best & Worst Performing Mega Cap Stocks for July 10, 2025
AEXAY leads the way today as the best performing mega cap stock, closing up 13.49%.
Best & Worst Performing Mega Cap Stocks for July 9, 2025
AEXAY leads the way today as the best performing mega cap stock, closing up 13.49%.
Best & Worst Performing Mega Cap Stocks for July 8, 2025
AEXAY leads the way today as the best performing mega cap stock, closing up 13.49%.