Let me start with some important disclaimers.
I am not a perma-bull. Nor am I a fearmonger who enjoys writing doomsday type articles to gain more attention.
I just so happen to follow a top-down investing approach which starts with an honest discussion of the economic environment. That’s because the direction of which sets the paces for stock prices. And unfortunately there have been a few things in the past week that are troublesome.
So let’s do a roll call of the important economic reports and what they tell us. We follow that by a discussion of how this all comes together and what we should do next.
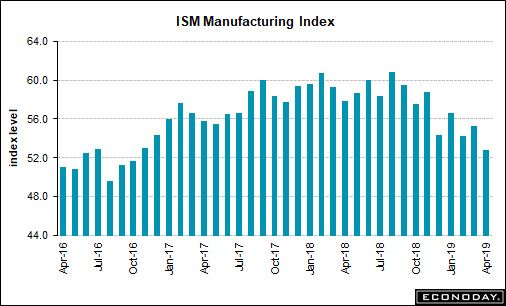
Manufacturing: Lets get the worst one out of the way first. This sector may only be 15-20% of the US economy, but we call it the “Canary in the Coal Mine” given that it often gives the early warning signals. And yes, it has been trending down for quite some time as you will see in the chart below leading to the weakest showing in over 2 years (announced 5/1). The story gets worse as the forward looking New Orders component is also on the decline with a 51.7 showing.
Now a little dash of optimism. The reading of 52.8 is lower on a relative basis than the recent past, but it’s still in expansion mode. Plus we have hit this level or lower several times over the this 10 year bull market before bouncing back higher.
In addition, the competing PMI Manufacturing report, created by Markit, shows a modest increase for April versus March. And historically the PMI version of the report is considered the better early indicator of trend.

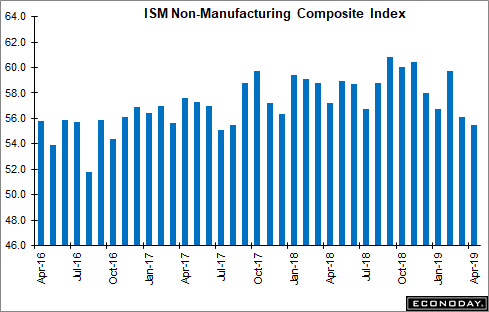
Services: Gladly this larger portion of the economy is showing healthier results at 55.5. That is about the midpoint of results over the 10 year bull market…but definitely a decline from recent peaks over 60.

Pessimists will say that both manufacturing and services are declining. Optimists will say that both are still in expansion mode.
Employment: The Government Employment Situation report released 5/3 could not have been more well received as stocks sprinted back towards the highs. Jobs added for the month were 46% above expectations with the unemployment rate dropping a full 0.2% to a new 50+ year low.
Retail: Usually employment is the leading indicator for retail. That’s because the healthier the outlook for jobs, the more comfortable the consumer is spending whatever they find in their wallet. Gladly that is about as good as it gets now with Redbook weekly retail sales consistently showing 5-6% year over year gains.
Corporate Earnings: Q1 earnings season was better than the ultra weak expectations of a -4% decline in EPS for the S&P 500. We did end up modestly in earnings growth territory thanks to a very high % of upside surprises. Clearly investors saw earnings season as a net positive given that shares did finally push to new all time highs.
Inflation: There are several different flavors of this important factor, but the Feds favorite is the core reading of PCE Price Index. That came in earlier this week at +1.6%. That is lower than the target level of 2% and tells you why the Fed is not raising rates right now.
Overall Picture: GDP provides the best way to combine all these elements together. There we find that two of the most popular estimates of GDP show a Q2 slowdown from the robust +3.2% pace of Q1.
+1.7% estimate for GDP Now (Atlanta Fed)
+2.6% from Blue Chip Economist Panel
The final estimates can move quite a bit over the next couple months before the actuals come out, but right now it says no cause for alarm as we have spent most of the last 10 years growing at a 1.5 to 2.0% pace.
What to do Next?
Most likely this is just part of the ebb and flow of the economy. That is why the market is taking it in stride as we ended Friday pressing the all time highs.
However, when you are sitting on top of a 10 year bull market, it is prudent to keep looking for signs of the end so you are not the last one out the exits. So this has me on a higher state of alert for any additional signs that could foreshadow the bear coming out of hibernation.
To be 100% clear…I am still 100% long in my investment accounts because I strongly believe in the axiom “It’s a bull market til proven otherwise”.
I will just be watching the economic data that much more closely going forward. And I will be sharing with you my new findings in future editions of this email newsletter.
In the meantime be sure to take advantage of some of these resources available on my investment websites (StockNews.com & ETFDailyNews.com).
Best Performing Small Cap Stocks
Top Stock Industry Categories Performance
Best ETFs List using SMART Grades
ETF ratings Upgrades/Downgrades
5/1 Reitmeister Webinar On Demand Video – Includes 9 key lessons learned from my 40 years of investing experience…and how to apply that to today’s market.
Wishing you a world of investment success!

Steve Reitmeister
…but my friends call me Reity (pronounced “Righty”)
CEO, Stock News Network
About the Author: Steve Reitmeister

Steve is better known to the StockNews audience as “Reity”. Not only is he the CEO of the firm, but he also shares his 40 years of investment experience in the Reitmeister Total Return portfolio. Learn more about Reity’s background, along with links to his most recent articles and stock picks. More...
9 "Must Own" Growth Stocks For 2019
Get Free Updates
Join thousands of investors who get the latest news, insights and top rated picks from StockNews.com!


