StockNews.com
  • Login Join

StockNews.com
  • News
    • Top Stories
    • Video News
  • Best Stocks
    • "A" Rated Stocks
    • Upgrades/Downgrades
    • High Yield Dividend Stocks
    • Stock Screener
    • Top Stocks by Target Price
    • Dividend Discount Model Stock Valuation
    • Industry Rank
  • Best ETFs
    • "A" Rated ETFs
    • Best ETF Categories
    • High Yield ETFs
    • 7 Best ETFs
  • POWR Ratings
  • Upgrades/Downgrades
  • Watchlist
  • Screener
  • Services
    • Services Home
    • POWR Platinum
    • Reitmeister Total Return
    • Stocks Under $10
    • POWR Options
    • POWR Value
    • POWR Screens 10
    • POWR Income Insider
    • Premium
  • Login Join


  • Home
  • Articles posted by Stock News
  • Uncategorized

POWR Stock of the Week Under $10: ProFrac Holding (ACDC)

Teaser: Oil prices were nothing if not volatile last year, and nothing indicates this year will be any different. With prices trading at the bottom end of the range as we enter 2024, now may be a great time to take a look at some beaten down oil stocks. One company working to get the supply/demand mix right for its products after a rough patch in 2023 is ProFrac.

Oil certainly had an up and down year in 2023, gyrating between fears supply would be curtailed by OPEC, driving prices higher, and fears of a recession, which would crush demand, driving prices lower. And while crude finished the year near the low end of its range, now may be a perfect time to look at oil stocks as it looks more and more like a soft landing is in progress. 

One oil stock which had a rough 2023 but which management feels is on track to outperform in 2024 is ProFrac Holding (ACDC). ProFrac manufactures fracking units and pumps for the oil drilling industry. The company has recently been expanding into electric fracking units which reduce both carbon emissions and noise pollution. 

2023 caught the company a bit flat footed in matching their units and pumps with the erratic demand. But, as Executive Chairman Matt Wilks put it in the latest earnings release, “”Our current visibility gives us confidence that 2024 will be much improved over 2023. We are well-positioned and excited for the coming year.” Which means this could be the perfect time to pick up ACDC on the cheap.

The company currently trades at 9x earnings, and 6x forward earnings, with a PE ratio of just over 8. Its stock is going for a lowly 0.5x sales and 4.2x free cash flow, which puts it in the undervalued category in my estimation. Its gross margins currently clock in at around 30%, and operating margins close to 20%.

The stock, which is now just under $8, traded as high as $14.00 last year as oil prices rose over the summer. Right now the consensus target price is nearly $5 higher than the current price, which should put the company in a great position if oil bottoms out here. 

What To Do Next?

If you like the stock shared above…then you will love this new special report sharing 3 low priced companies with tremendous upside potential.

3 Stocks to DOUBLE This Year >

  • Home
  • Articles posted by Stock News
  • Uncategorized

2022 Stock Market Outlook

I just wanted to share with you my brand new presentation recorded at the Mad Hedge Online Investor Summit:

2022 Stock Market Outlook >

The title is pretty self-explanatory. So as we are come down the home stretch of 2021 it is the perfect time to start contemplating what lies ahead for next year.

Let’s remember that the market is already up over 100% from the lows of March 2020. So indeed the easy money has been made.

Even worse, some are pointing out the bubble like conditions in stock market valuations. On top of that you have the highest inflation rates in decades which is usually a big negative for stock prices.

Also the trillions in government stimulus spending during the Covid crisis is no longer flowing through the economy.

Add it altogether and you see it’s going to be quite a different landscape in 2022. Thus, it’s vital that we wrap our minds around the pros and cons to chart a new course to outperformance.

This presentation will give my most up to date stock market outlook & trading plan for the year ahead which includes:

  • Bull Case
  • Bear Case
  • 2022 Year End S&P 500 Target
  • Trading Strategy to Outperform
  • Top 12 Stocks for Today’s Market

Enjoy this on-demand presentation by clicking the link below:

2022 Stock Market Outlook >

Steve Reitmeister
…but everyone calls me Reity (pronounced “Righty”)
CEO, StockNews & Editor of Reitmeister Total Return

  • Home
  • Articles posted by Stock News
  • Uncategorized

Silver News: Will the price continue to move lower?

Precious metals investors have no doubt been alarmed at silver‘s (and gold’s) recent drops.  Just a few short months ago, there was lots of enthusiasm about “the next leg up” and how silver was close to all-time highs in the silver-to-gold ratio.  Seemed like every talking head on TV was on high alert for increasing silver prices.

But then reality hit, and as is often the case it wasn’t pretty.

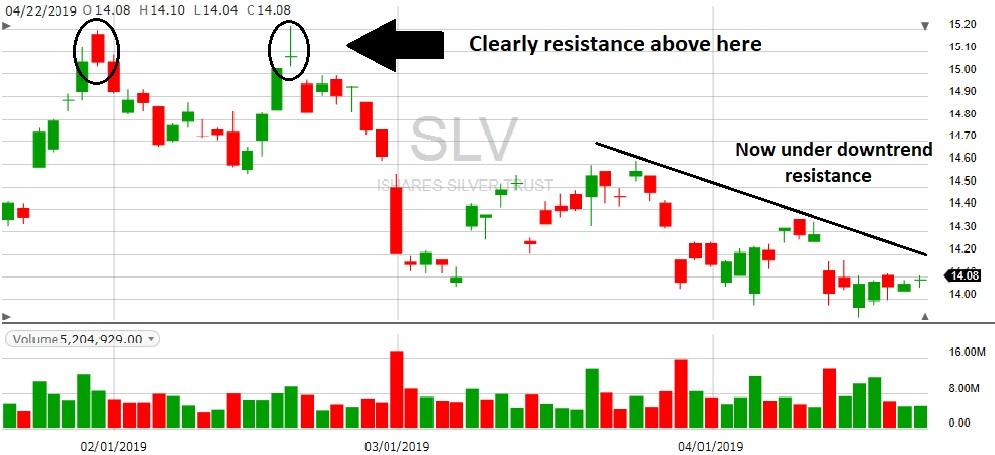
ISHARES SILVER TRUST PERFORMANCE

(credit: Fidelity.com)

SLV, the unleveraged US trading proxy for silver, fell 7.6% in two short weeks between Feb 20 and March 7, dashing the hopes of silver bulls everywhere.   The chart shows a clear failure to rise above previous resistance at 15.20, stopping at 15.21. You can’t really call this a head-and-shoulders situation, it’s a good old-fashioned resistance level.  And since the two peaks are so close together we don’t have to worry about time decay or anything like that.

The real question now is how low can silver go?  For that, we need to look at a longer-time chart.

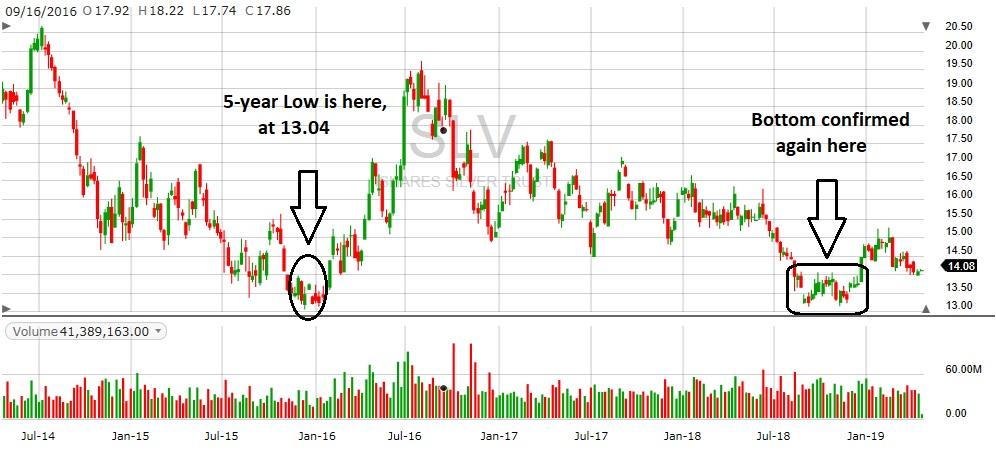
ISHARES SILVER TRUST 5 YEAR LOW

(credit: Fidelity.com)

That’s not a very pretty picture.  The 5-year chart for SLV shows a low of 13.04 back in 2015, which was confirmed twice last year with dips down to 13.11. From where SLV is right now at 14 there isn’t any sign of support until 13.50, then just a hint there.  Next stop down is the 13 level.

Of course, those are SLV prices.  Translating that to international silver prices, we find almost exactly a 1-point difference.  So international silver is just below 15 this morning and looking weak.  If it does continue down, next stop is at 14.50, then the 5-year bottom down at 14.00.

How likely is it that we will see silver drop more from here?  Your Gold Enthusiast thinks it’s pretty likely, since traders were starting to load up on long silver a few months ago.  Most of those positions were probably unwound by now, but the steps down so far have been controlled, no signs of sudden capitulation like we usually see just before real bottoms.  So we’re suspecting there is still one more leg down from here, if not two more all the way down to the 5-year lows.

Buckle on the parachutes, this could be a sudden drop.  Then get ready to buy!

Signed, The Gold Enthusiast

DISCLAIMER: The author holds no positions in any mentioned security.  His only positions in the silver sector are very small holdings in Fortuna Silver Mines (FSM) and Silver Bull Resource (SVBL), with no plans to trade these in the next 72 hours.

  • Home
  • Articles posted by Stock News
  • Uncategorized

Why I believe ETSY Inc. (ETSY) could make a move higher

Wal-Mart (WMT) and Amazon (AMZN) has a left many sellers with a “you can’t live with them, can’t live without them” proposition.

Gaining distribution through the “big two gorillas” can propel a business to tremendous sales growth and success and may actually be companies survival.

But it comes as a cost as Amazon and Wal-Mart leverage this power by extracting hefty demands, from extremely low prices, quick turnaround times on fulfillment, and they force less favorable terms on sellers regarding invoice and reimbursement.

Now vendors and sellers are learning not only is Amazon a tough partner to do business with, but it can also turn into a brutal competitor. Amazon has developed a pattern of taking hot item, producing their own variation or knock-off –which they underprice and overpromote—essentially co-opting many successful brands or products.  

Amazon is taking similar aggressive action for companies, especially start-ups, that use its AWS platform to run their businesses. It has copied and implemented other companies software and data services, white labeling everything from batteries and detergent to data analytic tools.

But smaller retailers are finding alternatives and fighting back.  Such as doing business on Etsy (ETSY), an online platform seller (and buyer), of mostly small businesses featuring unique or handcrafted items.  It’s distinguished itself as the something of the anti-AMZN or at least a way not to get swallowed up by beast.

The handcrafted and personalization of many of the products it features appeals especially to millennials.  Etsy works with the businesses to help them offer customization options which it says helps garner an average 30% increase in selling price.  

Etsy’s top categories are fashion- including apparel and accessories such as jewelry– and home furnishing which combined comprise a $1.3 trillion addressable market.

Etsy, is not yet profitable but has been growing revenue by over 40% per year and more importantly boosting margins to above 30%, not an easy feat in cutthroat online merchandising, but crucial towards achieving profitability.  

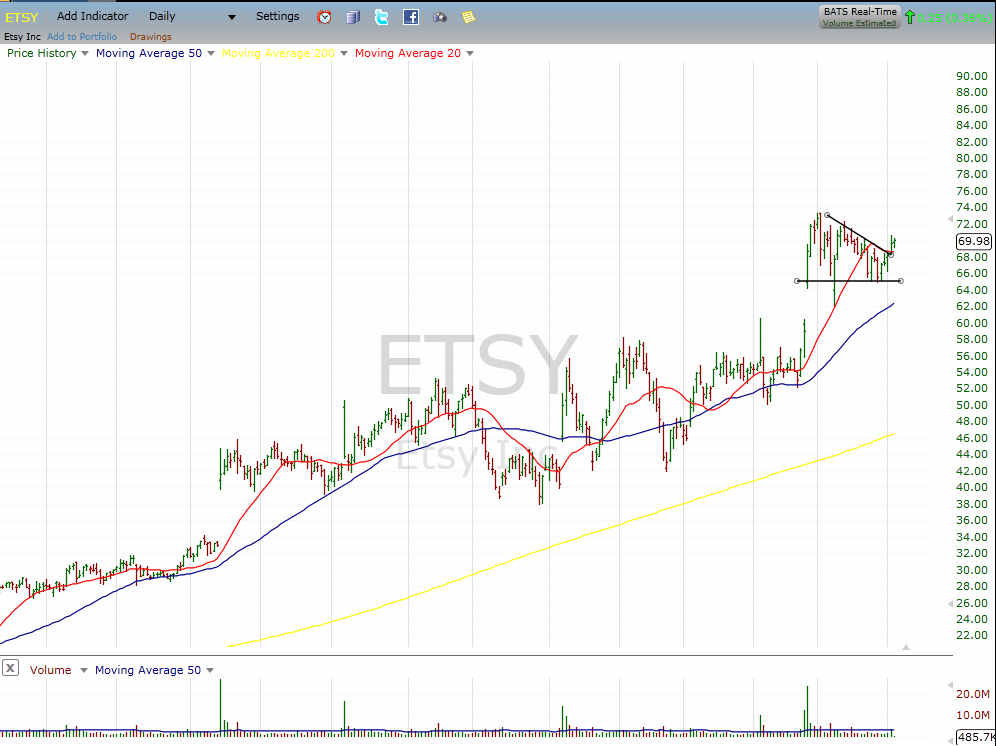
From a technical standpoint the chart shows a nice period of consolidation into a bullish flag following last month’s earnings gap up.  
image1Steve

Source:FreeCharts.com

I think the company could make a run to new highs ahead of its next earnings report, scheduled for May 7, and I’m buying the May 70 calls for $5.50 per contract.

My target is for shares to hit $80 which would double the value of the calls.

  • Home
  • Articles posted by Stock News
  • Uncategorized

Why the volatility in the S&P 500 (SPY) is a historic trading opportunity

At the end of 2008, in direct response to a once a decade opportunity, I started a groundbreaking options newsletter called The Phoenix Letter.

You see, the Phoenix arises out of the ashes and at that time, the market was presenting a historic opportunity.

Some of our very first Phoenix Picks became the tales of legend:

BLK at 130, went to 594 and now back down to around 400.

JPM at 35, now around 100.

CRM at 25, went to 162 and now around 150.

SBUX at 10, now around 65.

As the historic bull run continued, the Phoenix had done its job and remained dormant for years.

Now, once again, 10 years later, we are seeing another historic opportunity in the markets.

AAPL was once 230 and is now around 150.

WYNN went from over 200 and is now around 115.

NVDA, FB, NFLX, BABA all decimated.

The time has come for the Phoenix to rise again.

I’ve put together a team of traders that are bringing their unique talent and option strategies to make a boatload of money for themselves and a select group of qualified individual traders – not greedy bankers that wouldn’t know what to do with this kind of technical analysis – YOU – the person that just wants to find some trades that make sense and profit from them.

This team of ‘mercenaries’, for lack of a better term, have all been employed by highly respected financial firms.

Members of this ‘group’ have been featured in Barron’s, WSJ, CNBC, Forbes and Fortune.

Some of the members appear regularly on CNBC and Fox Business News.

The Key to Our Success Is 2 Simple Things.

  1. Regardless of what’s happening in the market or the world, the most essential aspect of your trading will be Stock Selection. Stock Selection will be the difference between being a part of the stocks that skyrocket to new highs and leaving behind the laggards that will never see the sun again. Solid technical analysis will be a key aspect of this stock selection.
  2. Using Options to minimize risk and obtain amazing profits. We will only be using calls. This stock market requires a unique approach and that is exactly what you will get.

Unlike past newsletters or recommendations that you have received, we don’t just tell you to buy a stock and then forget about you with the audacity that we can’t be wrong.

We accept that not every stock we recommend will do what we expect, and we provide a contingency plan.

We’ll not only recommend what’s going to be great, but we’ll provide you with an exit!

On the upside and the downside.

This way, you can lower your exposure and still benefit from all the upside that the Phoenix will provide you with.

How confident are we that you will be with us for this run?

Here’s the answer: We are going to be highlighting the ultimate option trades that can make you thousands of dollars a week and you can try it out for $19.

This is a special limited time offer so take advantage of it now!

Give us a 30-day trial for just $19.

$19 gives you four weeks of access to all The Phoenix trades.

This ‘call only (or puts) option strategy’ will come in under my own Mesh Private Portfolio brand.

This means, in addition, to the timeliest options trades, you’ll have complete access to my weekly market call, our in-house gold specialist and all major 2019 opportunities.

The Phoenix was brought back to take advantage of this once in a decade opportunity and the time for that opportunity is now!

There are thousands to be made every week and it’s only $19, send me the trial now.

The market had its worst December ever but that also included the Dow’s biggest 1-day gain in its history, that only means incredible opportunities for the individual trader.

We are opening up 100 spots today and expect our first trade to be tomorrow or early next week. At that point, expect 1 or 2 trades per week (on average as we will not force it if nothing is there and will trade more during major opportunities).

Our promise to you:

  • We will not expose you to cheap penny stocks that are most likely to cost you more than you will ever make.
  • We will provide you with real stocks based on technical strategies and use options to trade them so that you are doing what Wall Street does, not what they say.
  • We’re never going to be open to the masses but as a member of the AMTG community, you have a unique opportunity to get in now for just a $19 trial.

You might have one more question… What happens after the one-month trial?

Our answer: In order to help as many people as we can but still provide the same next level VIP support we always do, the monthly rate to stay on is just $89.

There’s no commitment to stay and your price will never go up.

You get to see some amazing trades for just $19 and if we do what we are supposed to do the $89 will be irrelevant to the money made available.

We look forward to a long and prosperous relationship with you.

All the Best,

Adam Mesh

P.S. After you make some solid trades with us, please take the time to let us know about your success. We like money, but we thrive on positive feedback!


  • Home
  • Articles posted by Stock News
decrease arrow
  • Uncategorized

Have Earnings Estimates Come Down Enough?

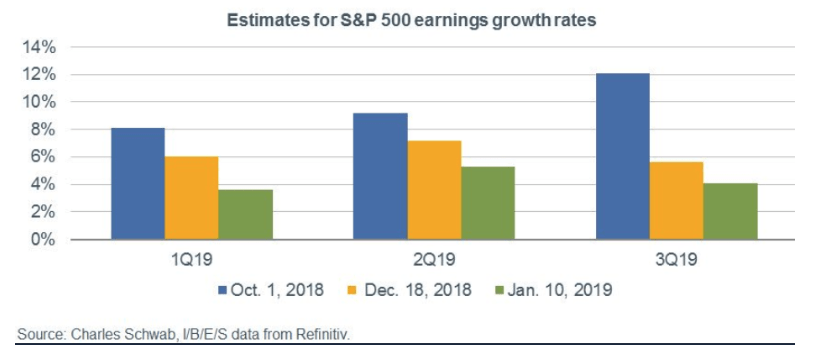
Corporations begin reporting fiscal fourth-quarter results in earnest next week and provide updated guidance for the coming year. Analysts have been tripping over themselves over the past few months, reducing 2019 expectations.  However, have expectations been sufficient lowered or will we experience even lowers lows?

Earnings for the S&P 500 reflect the fourth quarter of 2018 is expected to still show 12%-14% year-over-year growth but expectations for first few quarters of 2019 have been ratcheted rapidly lower over the past few months — with the latest set of data placing consensus for around 2%-5% through the first half of the year.

S&P 500 Earnings Growth Rates

The progression of reducing estimates this early in the year stands in sharp contrast to the historical pattern, which usually starts with optimism and slowly gets reduced over the course of the year as reality sets in.

But with a host of companies issuing warnings, analysts have been forced to revise their numbers and investors have been selling first rather than waiting for the results.

Certain sectors have already seen share prices decline over the prior few months, such as oil and semiconductors which is due to sub-$50 oil and weak chip demand.

But the first real company-specific warning shot came from FedEx (FDX) in mid-December when the shipper slashed its 2019 revenue guidance, citing worldwide slow down with special emphasis on China. FDX’s stock dropped over 15% over the next few days.

The next big salvo came from Apple (AAPL) on the first day of trading when it lowered expected iPhone sales with China once again being a locus of blame.  AAPL shares are now 33% below the October high.

Now, over the past few days — in quick succession — we’ve had airlines like Delta (DAL) and American (AAL) issue warnings and see their shares sink to new lows.

Warnings from retailers like Macy’s (M) and Gap (GPS) have also cast doubt over just how strong holiday sales were and the state of consumer spending.  

The silver lining to all these warnings is that the stock market tends to be a discounting mechanism; meaning some pretty bad news is now already priced into current share and valuation levels.

Indeed last earnings season, which was pretty strong across the board, was met with mostly negative reactions.  According to data compiled by Bank of America, companies that beat estimates outpaced the market by less than one percentage point in first-day reactions.

In fact, many stocks, especially tech names that had racked up big gains during the first half of 2018, sold off hard despite posting good numbers.  The punishment for falling short was more than twice as big with the stocks dropping an average of 7%, following an earnings miss.

So, with expectations now as low has they’ve been in over 3 years could we be setting up for a buy the news scenario?

Sundial Research looked at past instances when analyst sentiment deteriorated and found that such outbursts of bearishness actually boded well for equities.

Since Bloomberg began tracking the data in 2010, the spread between price-target upgrades and downgrades dipped below 150 five times. On all but one occasion, the S&P 500 rose two months later, posting a 6 percent median return.

Many companies should have no problem clearing the lowered hurdles and transforming the narrative from negative to positive.


  • Home
  • Articles posted by Stock News
  • Uncategorized

Did Apple Just Boost the Price of Gold?

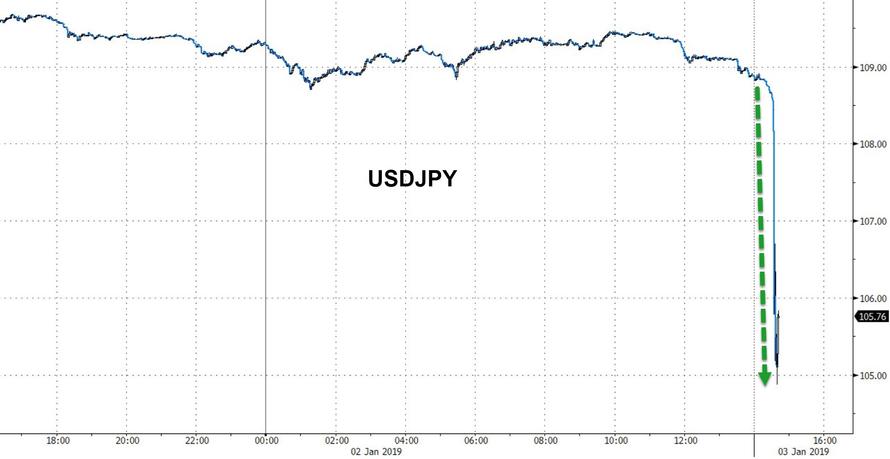
Every day we’re seeing more evidence that we live in a very interconnected world.  Overnight Apple released a revised earnings guidance letter, which is a fancy way to say “we didn’t sell as many iPhones as we expected.” This apparently caught the entire civilized world by surprise, especially since many folks have lost track of the reality that not everyone can afford a thousand-dollar phone. As a result, Apple stock futures tumbled overnight.  And along the way, they apparently dragged down – foreign currency pairs?

That’s right.  Here’s the overnight chart for the US Dollar-Japanese Yen (USD-JPY) currency pair.

USDJPY

On this chart, down is bad for the US Dollar and good for the Japanese Yen.  So what this says is investors – or at least currency traders – saw the prospect of a decrease in Apple revenue as threatening the value of the US Dollar.

Other currency pairs involving the US Dollar also “flash crashed” including the Australian Dollar and Chinese Yuan. Such a gyration could be expected to drive investors and traders toward safe havens, and it did.   Overnight gold hit a 6-month high and looks to open above yesterday’s close in New York this morning.

Worth noting is this is Apple’s first such downward guidance in 15 years.  Given that this bull market is 9 years on, it’s probably as close to a black swan event as we’re likely to see so close to the holiday season.  Your Gold Enthusiast thinks this will add more concern to investor anxiety, but won’t be enough to push the market over the edge.  For that, we’d probably need poor earnings reports in January, and more angst out of the EU. We’ll have to wait about 6 weeks to see if the first of those shoes drop.

Signed,

The Gold Enthusiast

DISCLAIMER: The author does not trade currency or currency pairs, and so has no positions in those mentioned in this article.  The author is long the gold miners via small positions in NUGT and JNUG, with no plans to trade those in the next 48 hours.


—————————————————————————————————

The Greatest Trading Book Ever Written

I have been working very hard to introduce you to the greatest trading book ever written. At my trading firm, the very first thing that any new trader had to do was read this book. They wouldn’t be allowed in my office if this book was not read. Now, I’ve taken this book and built an entire trading system around it. For anyone that has any interest in trading, this is a must-read. It’s about success, failure and then success again. This book is being offered today, Get Your Copy Now

  • Home
  • Articles posted by Stock News
  • Uncategorized

4 Options Trading Books That Should Be on Your Holiday Reading List

With the winter holidays and New Year’s break just around the corner, this is the perfect time to brush up on your options knowledge. Not that I wouldn’t reach for the latest Jack Reacher novel, object to the suggestion of Grisham’s courtroom intrigue, or deny the deal-making put forth by Trump.

But as someone who writes about and actively trades options, I belong to the camp that believes options are a valuable investment tool that, when properly utilized, can boost returns and reduce risk. So, instead, impress your neighbors, annoy your family, and study yourself into a well-deserved siesta with some of the best books and resources on options. It may lack the drama of reading central banks interventionist policies, but I promise the long-term benefit is better.   

That said, I acknowledge the validity of many of the arguments made against options. Perhaps pointing out the most common pitfalls, rather than proselytizing on the benefits, is the best approach to bring some even-handedness to the subject. 

I’ll tee up a few topics and offer some reading suggestions for those that want to delve deeper and don’t mind being curling up near a fire with a hot toddy and swiping through an options book or tablet.


Operation Manual


As with any tool, before using options, make sure you are familiar with the basic rules and guidelines that govern their behavior. 

For starters, make sure you know the contract specifications of the product you are trading. Items such as margin requirements (pay special attention to leverage), the exercise and settlement procedures, and what strikes and expirations are currently listed for trading are important to know.

For example, you should be aware that index options, such as for those on the S&P 500 or SPX, can only be exercised on expiration day and are cash settled; also note that SPX options actually cease trading on the third Thursday of the month, a day earlier than equity options, though they officially expire on the third Saturday. 

By contrast, equity options, including those on the Spyder Trust (SPY), can be exercised at any time during the life of the contract. This is especially important when trading options on stocks that pay dividends. 

This information can easily be found at exchange websites such as the Chicago Board of Options Exchange  (CBOE) page. Another great source of education is the Options Industry Council.

A terrific book that covers all the basic concepts and strategies is Options as a Strategic Investment by Lawrence McMillan.  

The next level is Option Volatility and Pricing: Advanced Trading Strategies and Techniques by Shelton Natenberg.


Dealing in Dividends


If you own in-the-money calls on Exxon (XOM) make sure you know when the ex-dividend date occurs — you will need to exercise your calls if you want to qualify for the payment. Likewise, if you are short on an in-the-money call on a dividend-paying stock, be prepared for assignment and being short the actual shares the day before it goes ex-dividend.

Most ETFs pay dividends. Some, like the Spyders, payout on a quarterly basis and for some reason the ex-dividend date often falls on the Thursday prior to a quarterly expiration — meaning many people have failed to exercise an ITM call and lose out on the dividend while others or are unwittingly assigned puts and forced to pay.

Others, like the Dow Jones Diamonds (DIA) make monthly distributions. The point is, knowing the basic rules by which the various vehicles operate will help you avoid surprises such as an early assignment on an in-the-money call. 

Jargon Slashing

Options traders, like other professionals, love to use industry jargon. Talking the lingo serves several purposes: It connotes a high level of knowledge and expertise in one’s specific field, it accurately conveys complex concepts in a concise manner, and it just sounds so cool to say things like, “I’m long vol up the ying-yang and bleeding theta,” which basically means one owns options that are suffering from time decay. 

The downside of lingo is that sometimes it’s used to purposely conceal the true level of understanding, or it is simply a means for the speaker to bolster his self-esteem and get the upper hand in a conversation or negotiation.

This can be very off-putting to the layperson put in the position of deferring to the expert because he is reluctant to ask a “stupid question.”   So, with that in mind, while it’s not important to know all the jargon it is imperative to understand the concepts so as not to make a needless costly error.   

Or that scalping gamma is a fancy way of saying “I’m trying to buy low volatility and sell higher volatility as the price of the underlying stock moves back and forth within a trading range.” 

Some basic concepts of option pricing models such as Black-Scholes, and what the “the greeks, especially delta and theta, mean an how they measure options’ value.

For deeper dives into there are plenty of good books out there.  One of my favorites on harnessing Vega and Gamma is Options Volatility Trading: Strategies for Profiting from Market Swings by Adam Warner.  

A great site for finding and analyzing current and historical volatility, along with an amazing amount of free tools, is iVolatility.

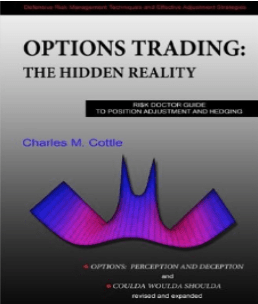
Some of the best option books I’ve ever read, come to Charles Cottle whom I’ve had the pleasure of sharing a panel with on several occasions. His Options Trading: The Hidden Reality blew my mind. I had to go back and read it again. I still only understand only half of what he was saying.

options trading hidden reality book

That one will both enlighten you and put you to sleep at the same time.  Enjoy the weekend.

ultimate guide to options trading

For some lighter fare and the best, quickest, and cheapest, way to get an introduction to an options system through my free ebook, The Ultimate Guide to Trading Options.  Click Here to get your FREE COPY.

  • Home
  • Articles posted by Stock News
stock market chart
  • Uncategorized

Why You Shouldn’t Believe the Hype About a Pending Market Crash

I think we can all agree that periods of intense market volatility, such as this current correction (the second of the year) are nerve-wracking. Even long-term value-focused contrarian investors like me sometimes get rattled when stocks fall fast and hard.

But given that we’re now seeing such incredible fear, uncertainty and doubt on Wall Street, it’s important that you not let the market’s declines nor the hyperbolic media panic you into making a costly mistake. So let’s look at three important lies that are very popular today, but could cost you a fortune if you let them shake you from your long-term investing plan.

Lie 1: This Is Unusually High Market Volatility

Stocks continued to be rocked by volatility down nearly 3% as I write this after falling 3.2% on Tuesday, December 4th. That puts us back at 10.2% from the S&P 500s September 20th all-time high, the last low we reached two weeks ago. Many investors feel this is an unusual amount of volatility, thus possibly giving credence to the idea that “this time is different” and that we might even be in a bear market. Heck, even Wall Street veterans like Jim Cramer, who has been through plenty of market cycles in his day, are stoking such fears.

“I have tremendous contempt for this market, because every time you try to make money with it, it cuts your heart out. That’s a bear market,”- Jim Cramer, CNBC Nov 26th, 2018

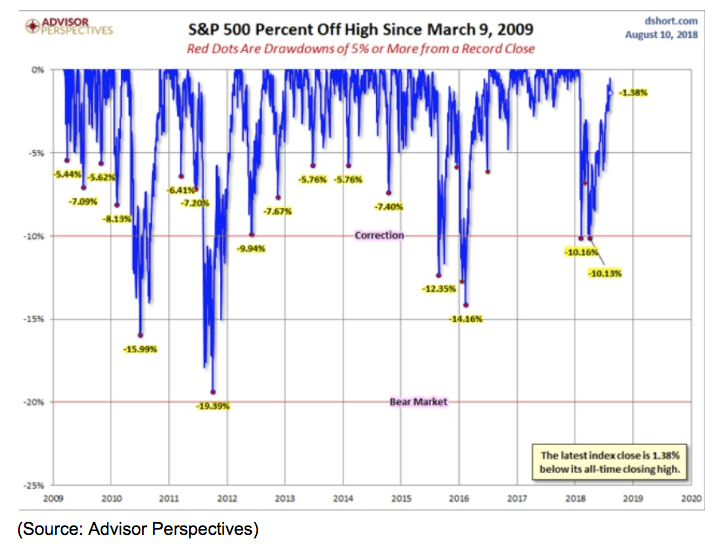
With respect to Mr. Cramer, this is NOT a bear market (20+% close below S&P 500’s all-time high). Nor is it necessarily likely to become one.

s&p 500 percent off chart

Since bottoming in March 2009 the stock market has seen plenty of pullbacks (5% to 9.9% declines) and corrections. In 2011 we even came within a stone’s throw of an actual bear market. Each correction is associated with its own market fears, specifically obsessing over risks to the economic and earnings fundamentals that ultimately determine share prices.

In 2011 it was fears over the European Sovereign debt crisis and the US debt ceiling showdown (US lost its AAA credit rating from S&P) that was supposed to plunge the world back into recession and send earnings tanking. In 2015 (a year which saw two corrections) it was fears over China’s slowing growth, rising interest rates, and crashing oil prices (sound familiar?)

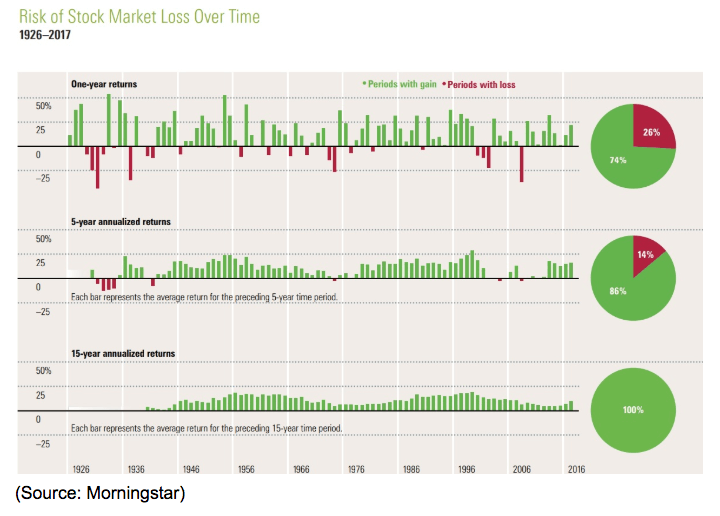
Now the market’s “wall of worry” is once more about Fed rate hikes, slowing growth (due to the trade war which is likely to end by February) and overall slowing global growth rates (plus a yield curve inversion in the US). But guess what? The stock market has generated 9.2% CAGR total returns since 1871 through far worse events than these current risks. We’ve suffered depressions, World Wars, killer flu pandemics (1918 Spanish flu killed 5% of the world’s population), and numerous recessions and financial crises. Unless you think the world is literally going to end it’s almost certain that the stock market will be higher over the next five to 15 years.

stock market loss over time

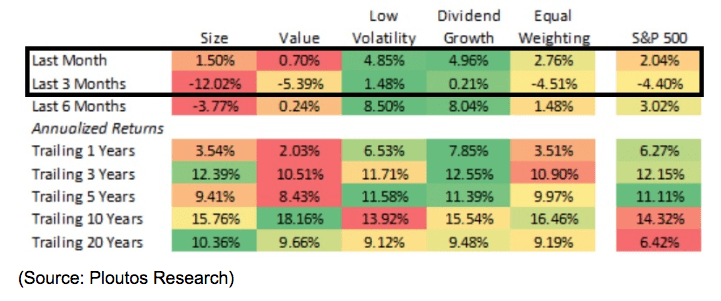
And in the meantime, there are plenty of investing strategies you can use that have proven to outperform the market over time, and with lower volatility during downturns.

market volatility chart

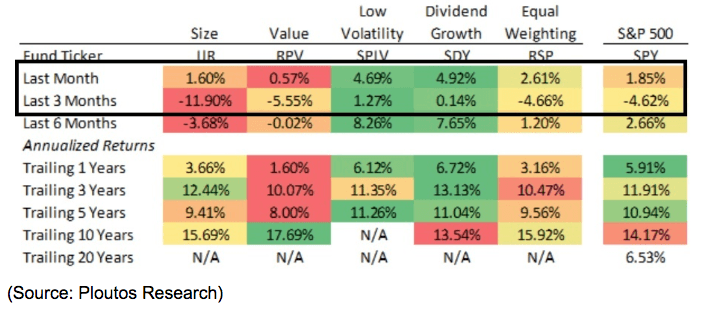
During this correction low volatility stocks and dividend growth stocks (my personal investing strategy) have crushed the market. If you are a passive investor then you can use low-cost ETFs to invest in these “smart beta” strategies.

3 month volatility chart

But what about all the claims that the bull market is too old to survive any longer? After all, it’s now the longest bull market in history (in its 10th year) and we’re due for a bear market right? Actually, that’s not true either.

Lie 2: Rising Risks Mean This Is Likely a Bear Market

“Bull markets are born on pessimism, grow on skepticism, mature on optimism and die on euphoria.” – Sir John Templeton, Founder Templeton Funds

I like to remind investors of this famous quote from John Templeton because the very correction we’re now in makes a bear market less likely to actually happen. On September 20th the market was not a sea of euphoric investors who were blindly buying into stocks out of “fear of missing out” or FOMO. Bull market tops typically see bears silenced and grudgingly buying stocks because “there is no alternative” or TINA. On September 20th you could reliably find the financial media eagerly discussing all the reasons the market might crash. Perma-bears like John Hussman, who has been predicting a 65% market crash since 2010, continued to proclaim a great bloodbath for investors is just around the corner.

But what about all the very real risks that we’re facing like Fed rate hikes and the trade war? Well, let’s actually apply some logic and look at the facts. Thanks to this third leg down in this correction we’re back to -10.2% from all-time highs. That’s the same level as two weeks ago.

Back then the risks of the Fed raising rates too far, too fast and tipping the US into a recession were far greater than they are today. 2 weeks ago the Fed was still on track for five or even six more rate hikes by the end of 2020. Last week both Fed chairman Jerome Powell and the Fed’s November minutes confirmed that we’re only certain to get one more rate hike (December) and then the Fed will consider pausing or even canceling any future hikes depending on how the inflation and macroeconomic data. Today the bond futures market is pricing in just 2 more rate hikes before the Fed stops hiking this economic cycle. Might the bond market be wrong about that? Sure, but the point is that last week the Fed officially threw the dot plot out the window and so the risk of “hiking until something breaks” is objectively less than it was the last time stocks fell to these levels.

Now let’s talk trade war. Two weeks ago Wall Street was terrified that the US would raise tariffs on $200 billion of Chinese imports from 10% to 25% on January 1st, and possibly impose 25% tariffs on the remaining $267 billion by mid-February. At the G20 meeting, a three-month trade war truce was struck, in which no additional tariffs would go into effect (or rate increases) until at least March 1st (which Trump recently said he might extend).

What about Trump’s now famous “tariff man” tweet which is largely blamed for November 4th’s 3.2% plunge in the S&P 500 (Dow fell 800 points)? Well, the market is forgetting that before his declaring himself the “tariff man” Trump also said about the trade deal “we will get it done. China is supposed to start buying agricultural products and more immediately. President Xi and I want this deal to happen, and it probably will.” Only after telling us that a deal was more likely to happen than not (greater than 50% probability) did Trump go off on one of his typical campaign-style stump tweets:

“But if not remember, I am a Tariff Man. When people or countries come in to raid the great wealth of our Nation, I want them to pay for the privilege of doing so. It will always be the best way to max out our economic power. We are right now taking in $billions in Tariffs. MAKE AMERICA RICH AGAIN…..But if a fair deal is able to be made with China, one that does all of the many things we know must be finally done, I will happily sign. Let the negotiations begin. MAKE AMERICA GREAT AGAIN!” – Trump

Since it’s US companies and consumers paying the tariffs it’s safe to assume that Trump’s claims that a trade war will “make America Rich Again” is typical hyperbole one sees from a politician in campaign mode. Meanwhile, even in that infamous tweet, Trump makes clear that he’s looking to strike a deal. Remember that he ran on being the “deal maker in chief” and promised a great trade deal with China. Despite his tough talk about cracking the whip on all US trading partners (and possibly pulling the US out of NAFTA) the US has now struck trade deals with South Korea, Canada, and Mexico, and is in final preparations for new deals with Japan and the EU. With 2020 fast approaching Trump needs a strong economy with a great labor market and strong wage growth to win.

While the trade war anecdotes are coming fast and furious the point is that the risks of our worst fears (25% tariffs on all Chinese imports by early 2019) are now substantially reduced. One can agonize over Trumps numerous and often contradictory statements and tweets, but the fact that no 25% tariff increase is coming January 1st certainly reduces trade war risk compared to two weeks ago, the last time stocks fell this low.

Which brings me to the most important point about both Fed rate hike and trade war risk. That the very fact that the market is freaking out over it is very likely the reason the Fed has switched to its new dovish mode and Trump struck a truce deal at the G20. President Trump is especially sensitive to the stock market, even going so far as to mention the strong 2017 rally in his last State of the Union declaring it evidence that his policies were working.

How would it look if Trump, the CEO in chief, were to see the longest bull market in US history end…over a trade war, he chose to initiate over the objections of the vast majority of economists, advisors, and corporate executives? Trump is already running for re-election and wants the bull market to remain alive and well. If stocks were to continue sliding (current macro fundamentals, valuations, and earnings don’t support a full-blown bear market) then the chances of Trump not striking a deal with China (even if it’s not exactly what he wants) go way down.

What about the Fed? Well, Powell has said that the Fed isn’t so much concerned with the stock market as much as the bond market. Specifically, the flattening yield curve that has fallen below zero (inverted) before every recession since 1955. But doesn’t that flattening yield curve mean this time really could be different and that a bear market is now upon us? While that MIGHT be true, here’s why it likely isn’t.

Lie 3: The Yield Curve Inverting This Week Means A Recession Is Coming Soon

While it’s true that the yield curve inverting is the most accurate recession predictor ever discovered, that doesn’t mean that the media’s recent hyping of the 2/5 and 3/5 curves inverting December 4th and December 3rd, respectively, is accurate. There are dozens of yield curves (yield difference between different duration treasury bonds) but not all are equally good predictors of recessions.

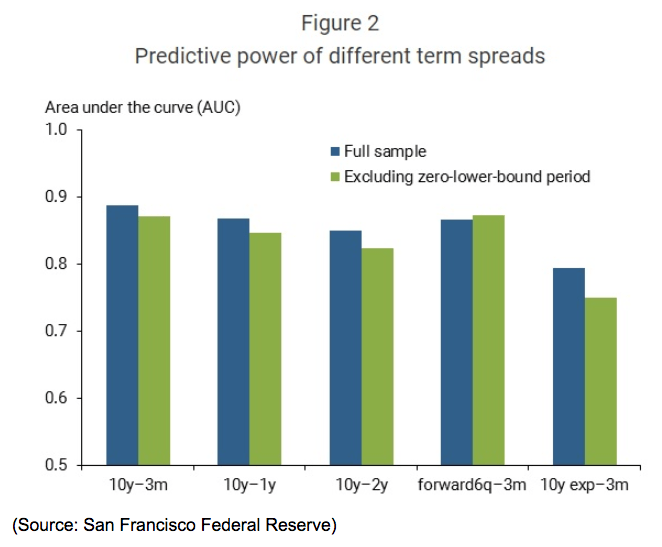
predictive power different term chart

According to an August 2018 study by the San Fran Fed, the longer the duration difference between yield curves the more accurate they are at predicting recessions. This is why the 10 year-3 month curve is more accurate than the 10y-1y curve which is more accurate than the 10y-2y curve.  And according to the study “The yield curve has been a reliable predictor of recessions, and the best summary measure is the spread between the ten-year and three-month yields.”

yield curve

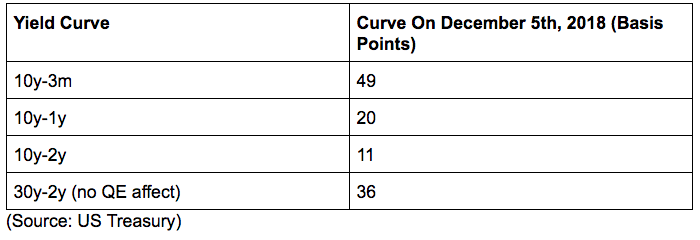
The 10y-2y curve is the most popular one tracked in the media (and the most studied). But it remains positive. The more accurate curves, including the 30y-2y one (which has not been affected by the Fed’s massive bond-buying over the past decade which artificially flattened the curves involving the 10 year-yield) remain a good distance from inversion.

yield curve recession chart

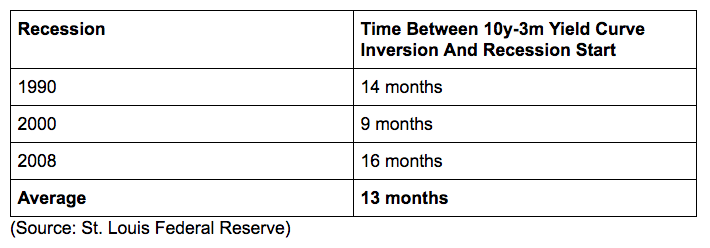
Remember that a flat curve is meaningless. The yield curve’s predictive recession power is binary. If the curve is positive then there is little recession risk. If it’s negative, then the recession countdown clock begins ticking down. Right now the most accurate yield curve, the 10y-3m, remains the furthest from inverting signaling that current recession fears are way overblown. At its current rate of flattening (since peaking in January 2010) the 10y-3m curve would take another 17 months to invert (May 2020). At which point a recession would be likely to begin within nine to 16 months (January 2021 to August 2021, most likely May 2021).

And keep in mind that this calculation (time to inversion) already bakes in the 0.3% decline in the yield curve over just the past few weeks (a historically unsustainable pace of decline). The curve has fallen so fast because of an epic rally in 10-year bonds that is unlikely to continue. That’s because, bonds, like stocks, never go straight up. The current melt-up in 10-year bond prices is being driven by both a flight to safety but also computer-based algorithms (it also involves a big short-squeeze). Most likely the 10-year yield will end up bottoming relatively soon and rallying significantly, thus pushing off a 10y-3m inversion even more.

What if the market panic causes the curve to invert anyway (fear of inversion resulting in rampant bond buying causing the very inversion investors fear)? Well, that could happen. BUT if the yield curve rises back above zero (rallies) then the recession countdown clock is reset. In other words, what matters the most in terms of recession prediction is the 10y-3m curve inverting AND staying inverted.

That’s not even close to happening right now and lines up with all the economic data I track each week in my economic updates. Basically, this means that given both the most accurate yield curve, and the current economic trends,  a recession is most likely to start 23 to 30 months from now, NOT next year. What about the start of a bear market? Well, that’s tougher to estimate but historically the S&P 500 tops about 8 to 13 months after an inversion.

  • Likely Recession Start range: January 2021 to August 2021
  • Likely Bear Market Start range: December 2019 to May 2020

These are my best probabilistic estimates of the start of the next recession and bear market. Of course, historical data and long-term trend extrapolation can only be so accurate, but I’m reasonably confident (enough to hold 100% of my life savings in stocks) that we’re NOT in a bear market right now.

And let’s not forget that the Fed rates hikes are a key reason short-term rates (like 3-month treasuries) have been rising fast and flattening the yield curve in the first place. Let’s say that one or more of the important curves, like the 10y-2y and 10y-1y curves, invert very soon, like next week. The Fed is scheduled to hike rates on December 19th. If one or more important curves are inverted by, and the stock market is close to a bear market as a result, then it becomes far more likely that the Fed doesn’t hike rates at all. In fact, as I write this the 10y-2y yield curve is actually UP 2 basis points because while 10-year yields are down 8 bp (flight to safety) 2-year yields are down 10 bp. The bond market is signaling that the market slide alone might be enough to cause the Fed to stop hiking rates even one more time. That itself would likely be enough good news to snap the market’s losing streak and put a bottom under stocks thus avoiding a bear market that is NOT supported by the current economic or earnings fundamentals.

Bottom Line: Don’t Believe the Media’s Hype About Economic And Stock Market Crashes

Currently, the US economy is on track to grow at 2.9% or possibly even 3% in 2018, and 2.5% to 2.7% in 2019 (even factoring in a trade war that doesn’t end in February). The global economy is expected to grow 3.7% this year and 3.5% next year (slower growth due to trade war). Slowing growth (including in corporate earnings) is NOT the same as negative growth.

Current market valuations are reasonable by historical standards (given our current long-term interest rates) and those valuations continue to improve as earnings are growing at over 20% this year while stocks are mired in this correction. In order for a bear market to be justified by fundamentals and valuations, it would take negative economic and earnings growth next year, which the economist and analyst consensus is NOT expecting (9% EPS growth next year and 9% to 9.5% in 2020).

And given that the Fed and Trump have shown themselves to be attuned to the market’s signaling of “for the love of god STOP what you’re doing!” the further the market falls in this run of the mill correction, the lower the risks the market is obsessing over actually have of happening.

The bottom line is that the actual facts about all the important things the market is worried over, (interest rates, the trade war, earnings growth, the economy, the yield curve) do not actually support the market falling even 10% more, much less 24% (historical average bear market since WII), or the 40% to 55% that some doomsday bears have been warning about for nearly a decade now.

That means that the best thing you can do is stay calm, buy stocks if you have the cash, and just ignore your portfolio if you don’t. The absolute worst thing you can do is give into panic and allow emotions, rather than logic and reason, to guide your portfolio’s decisions right now.


  • Home
  • Articles posted by Stock News
  • Uncategorized

The Most Important Recession Warning Sign Is Flashing Red

I think we can all agree that it’s important to know if a recession is coming, given that 82% of the bear markets since WWII have occurred during such market downturns.

The current US economic expansion is now in its 10th year and breaks the record for the longest in history on July 1st, 2019. So naturally many investors fear that the current expansion and bull market are “long in the tooth” and due to end fairly soon.

I track the state of the economy very closely each week, using no less than eight time-tested models comprised of dozens of leading indicators. Up until now, the economic fundamentals have been strong but now the most reliable recession predictor ever discovered is flashing red and showing disturbing signs that the recession clock may soon start ticking.

Find out the three things you need to know about why a recession may coming, when it’s most likely to arrive (and when the next bear market is likely to start), and most importantly of all, how you can protect your portfolio from any future economic/market storm.

Why the Bond Market is the Best at Predicting Recessions

On Monday, December 3rd the first of the yield curves (the difference between various maturity durations of treasury bonds) officially inverted trigger the media’s usual sensationalistic headlines. This was from Yahoo.

“The Treasury yield curve just inverted, sounding the alarm for recession”

Now it’s important to note that this was merely the curve between the three and five-year yields, which is one of the dozens of curves that exist. The 3/5 curve is NOT significant, because it lacks sufficient duration difference to meaningfully warn about a recession. But to understand why yield curves matter at all, first we have to know why they are historically the best predictors of recession ever discovered (the 1/10, 2/10 and 2/30 specifically).

US Treasury Spread

According to a March 2018 report from the San Francisco Fed, an inverted yield curve has “correctly signaled all nine recessions since 1955 and had only one false positive, in the mid-1960s, when an inversion was followed by an economic slowdown but not an official recession.”

Yield Curve Inversion

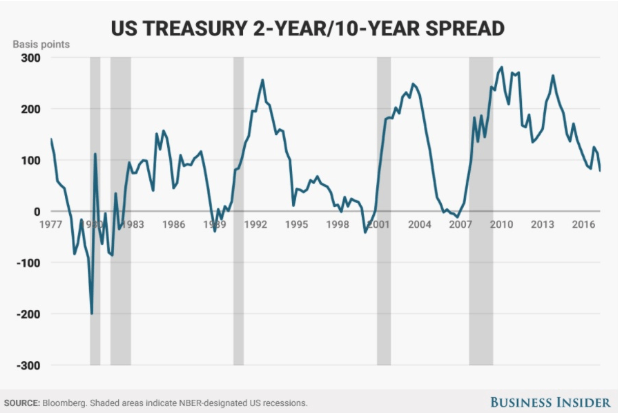
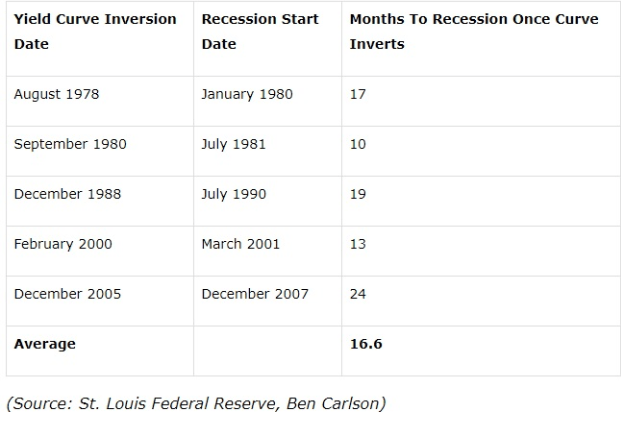
Now officially the yield curve (the 2 year and 10-year yield one) has predicted (with 90% accuracy) recessions with a six to 24 month lead time. But the average time from inversion to the start of a recession in the modern era has been 17 months.

inverted yield curve start

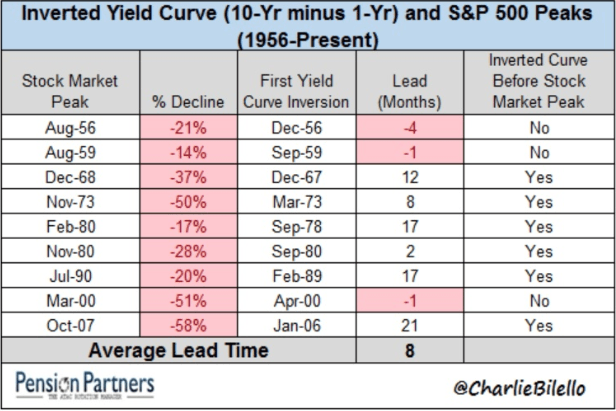
Unfortunately, the curve’s ability to predict the start of the next bear market (when the market peaks) is less powerful. That’s because the forward-looking stock market sometimes ignores an inversion and keeps climbing for nearly two years (as in 2007) or sometimes peaks just two months after an inversion happens. The average lag between a 2/10 inversion and the market topping is 13.4 months, but as you can see from the above table the market tends to either begin falling fairly soon after inversion or take a long time.

What’s more, using one other famous yield curve, the 1-year and 10-year curve, for which we have data stretching back to the 50s, shows that sometimes stocks can start falling even before the curve officially starts warning of an impending recession. This might prove to be the case this time, due to extreme market fear that could itself trigger a flight to safety that inverts one or more of the important curves.

10-Year Inverted Yield Curve

But why exactly does the yield curve have any predictive power at all? And just how dangerous is the outlook for stocks right now?

Are the Yield Curves Flashing Warning Signs About a Future Recession?

On Tuesday, December 4th, as I write this the 3 most important yield-curves (1/10, 2/10 and 2/30) stand at:

  • 1/10: 0.17% (down about 0.1% in 2 weeks)
  • 2/10: 0.11% (down about 0.13% in 2 weeks)
  • 2/30: 0.37% (down about 0.2% in 2 weeks)

There are two reasons that investors watch these curves so closely. One is that the $20 trillion US bond market is the most liquid major capital market on earth, and is seen as the ultimate safe haven “risk-free” investment. Our bond yields are driven by massive capital flows from insurance companies, pension funds, sovereign wealth funds, and other highly trained professionals whose job it is to keep an eye on the economy.

The other major reason that yield curve matters is because it can become a self-fulfilling prophecy. For example, the latest bank survey from the Dallas Fed shows that banks believe in the yield curve enough that, should the three important ones invert, they plan to pull back on lending to subprime borrowers. Decreased credit to consumers (whose spending drives 65% to 70% of the US economy) is a direct way in which an inverted curve can not just warn of a possible recession but actually cause it.

Another way to think about the yield curve is this. If enough people believe in its recession predicting power, then a flight to safety (out of stock and into bonds) can directly cause the important curves to dive fast and hard, as they are all doing now.

Similarly, the stock market, driven by short-term investor sentiment can feed off that fear, especially given that we’ve been locked in the second correction of the year (a “risk off” sentiment environment). This likely explains why the market, despite rallying in recent days due to the dovish Fed and a truce in the trade war, appears to be falling purely due to yield curve inversion fears.

Ok, so now that we know what the curves are, how accurate they tend to be (and what kind of warning time frame we can expect post inversion), what does that mean for your portfolio? How can you actually use this data to protect your hard earned money and nest-egg?

What You Can Do to Prepare for a Future Recession

The first step in preparing your portfolio for a recession is knowing what asset allocation is best for you personally. That means what the right mix of stocks/bond/cash is most likely to help you meet your long-term goals.

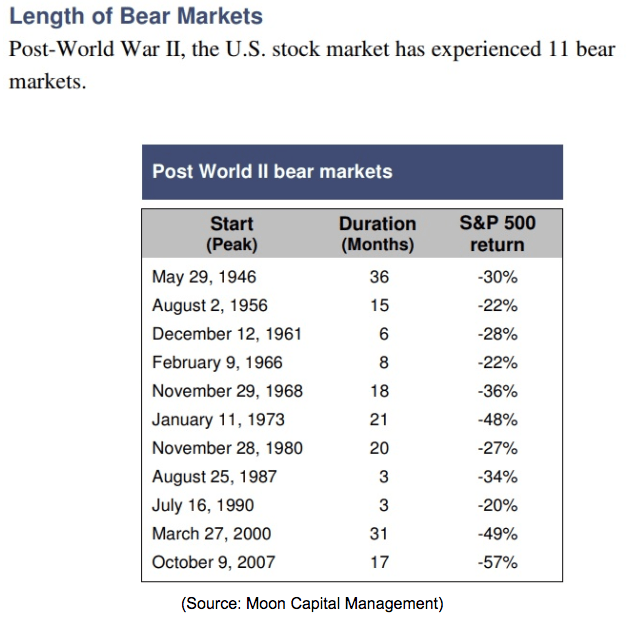
Post World War 2 Bear Markets

That’s because, since WWII the average bear market (82% of which happen during recessions) has seen stocks fall 34% over a 17 month period. Note that’s the time for the market to go from its previous all-time high (in this case September 20th, 2018) to its ultimate bottom.

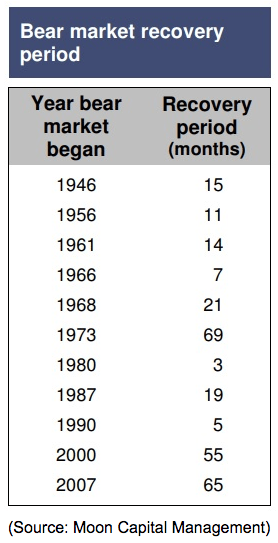
bear market recovery period

The average recovery time, meaning how long it takes stocks to go from the bear market bottom to fresh all-time highs (the official end of the bear market), is 15 months.

This means the average bear market, measured from the market top to market top, is 32 months long. Of course because the actual duration of these sharp downturns can vary depending on the severity of the recession and how much stocks decline, you want to make sure you have at least three to four years of cash (if you’re retired) factoring in your supplemental income such as Social Security and any pension you may have.

That allows you to avoid panic selling stocks during a market slide. This also applies to those using the popular 4% rule. If you are planning on taking out a set amount of money from your portfolio (like 4%) then make sure you can first draw on cash (or cash equivalents like short-term treasury notes or money market funds) before tapping other assets.

Next, there are bonds. These provide both income but more importantly tend to be countercyclical to stocks during a bear market. That’s both because treasury bonds are a “risk-free” investment that tends to go up during times when investors are fleeing risk assets such as equities. In addition, during recessions, interest rates are falling (Fed cuts short-term rates and long-term rates fall due to lower inflation expectations as well as the flight to safety).

In either case, once your cash is depleted (if you’re spending it to fund living expenses) then bonds are what you tap next (since they are either flat or appreciating in value). Stocks are in your portfolio for long-term capital appreciation (the best performing asset class in history) as well as to generate safe and growing dividends.

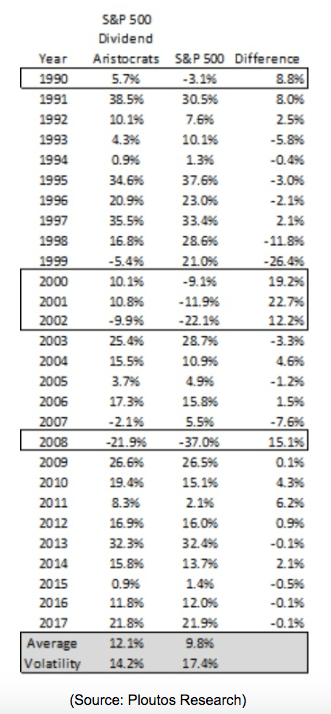
If your portfolio is large enough to live entirely off dividends, and you’ve built a diversified collection of blue-chips (like dividend aristocrats) then you’re lucky.

s&p 500 dividend

Since 1990 the dividend aristocrats have managed to outperform the market while suffering 18% lower volatility. Most importantly they tend to greatly outperform the market by falling less (or even rising) during recessions. Thus a blue-chip dominated portfolio of dividend stocks can provide you with a safe and growing income, no matter what stock prices are doing.

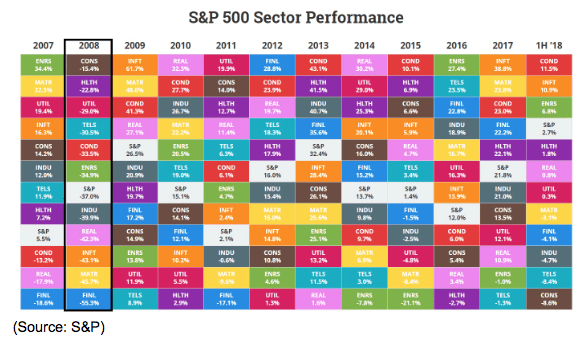
s&p 500 sector performance

Another way to structure your portfolio (the equity portion) is by focusing more on defensive sectors such as consumer staples, healthcare stocks, utilities, and telecom companies. While most stocks tend to fall during a bear market, defensive stocks (with recession resistant cash flows and safe and rising dividends) tend to fall far less.

It may be small comfort to watch your portfolio decline less than the market in general, but anything that can keep you calm and avoid panic selling is extremely valuable. Remember that numerous studies have shown that not just does market timing not work, but is the most destructive thing for regular investors to try.

Basically, ahead of a recession you should turn to asset allocation, not market timing, to protect your wealth. If you are overexposed to stocks (for your individual risk profile) then, by all means, shift more to bonds and cash, at least enough to ride out a three or four-year bear market. If your stock portfolio is packed to the rafters with economy-sensitive stocks (like high beta technology names and bank stocks) then you might want to shift that towards defensive sectors. And you can’t go wrong with dividend aristocrats and kings. While no stock is ever “risk-free” these are the bluest of the blue chips that are most likely to help you sleep well at night and keep a calm head when the bears run wild on Wall Street.

Bottom Line: It’s Never Time to Panic BUT the Bond Market Is Potentially Signalling it Might Soon Become Time to Start Getting Defensive

I’m a naturally optimistic person and a long-term bull both on the US economy and stock market. However, recessions and bear markets are a natural and healthy part of the economic/market cycle and so all long-term investors need to be aware of what warning signs to watch for.

Right now the yield curves, the most accurate recession predictors ever discovered, are showing troubling signs of distress. Specifically, the bond market appears to have become increasingly bearish about the future growth rate of our economy. It’s important to remember that the 3/5 curve inversion that happened on December 3rd is NOT important, but merely a troubling warning sign that the 7/10 warning curve (preceded 2/10 inversion before the last three recession) might be next to fall. Historically that means that the two most important curves, the 2/10 and 2/30 are not far from inverting and if they go negative (either one) then the official 6 to 24 month (17 average) recession watch clock begins ticking.

The good news is that even once an inversion happens a recession (and market top) are typically about a year (or more) away. This means there is usually plenty of time for investors to prepare their portfolios by shifting to lower-risk assets (while still sticking to their long-term asset allocation strategies) such as defensive stocks. This might include dividend aristocrats, kings, and or defensive sectors such as utilities, telecoms, healthcare, and consumer staples. And of course, building up some cash, either to fund living expenses or take advantage of fantastic bear market bargains, is also a wise idea should the two most important curves (2/10 and 2/30)  finally invert.

Above all else always remember that panic is never the answer, and all long-term investing decisions must always be approached methodically and rationally. There is no way to know the future with certainty, but we can use the most time-tested historical recession predictors to make educated probabilistic estimates about when the next downturn is likely to hit, and thus prepare ourselves financially, and emotionally for any economic/market storm that might be coming.

‹ Older posts

©2025 StockNews.com
About Us | Contact Us | Performance | Privacy Policy | Terms of Use | Supplemental Terms

Copyright © 2025. Market data provided is at least 10-minutes delayed and hosted by Barchart Solutions.
Information is provided 'as-is' and solely for informational purposes, not for trading purposes or advice, and is delayed. To see all exchange delays and terms of use, please see disclaimer.

This site is protected by reCAPTCHA and the Google Privacy Policy and Terms of Service apply.

Information contained on this website maintained by Magnifi Communities LLC is provided for educational purposes only and are neither an offer nor a recommendation to buy or sell any security, options on equities, or cryptocurrency. Magnifi Communities LLC and its affiliates may hold a position in any of the companies mentioned. Magnifi Communities LLC is neither a registered investment adviser nor a broker-dealer and does not provide customized or personalized recommendations. Any one-on-one coaching or similar products or services offered by or through Magnifi Communities LLC does not provide or constitute personal advice, does not take into consideration and is not based on the unique or specific needs, objectives or financial circumstances of any person, and is intended for education purposes only. Past performance is not necessarily indicative of future results. No trading strategy is risk free. Trading and investing involve substantial risk, and you may lose the entire amount of your principal investment or more. You should trade or invest only “risk capital” - money you can afford to lose. Trading and investing is not appropriate for everyone. We urge you to conduct your own research and due diligence and obtain professional advice from your personal financial adviser or investment broker before making any investment decision.

StockNews, a division of TIFIN Group LLC, is affiliated with Magnifi LLC (“Magnifi”) via common ownership. Affiliates of Magnifi will receive cash compensation for referrals of clients who open accounts with Magnifi. Due to this compensation, a conflict of interest exists since StockNews has an incentive to recommend Magnifi. Please see Magnifi’s Form ADV for additional information about fees and charges that may apply.