Apple Inc. (AAPL): Price and Financial Metrics
GET POWR RATINGS... FREE!
AAPL Price/Volume Stats
Current price | $177.64 | 52-week high | $178.99 |
Prev. close | $175.43 | 52-week low | $124.17 |
Day low | $176.57 | Volume | 37,474,961 |
Day high | $178.99 | Avg. volume | 62,719,852 |
50-day MA | $167.08 | Dividend yield | 0.55% |
200-day MA | $152.36 | Market Cap | 2.79T |
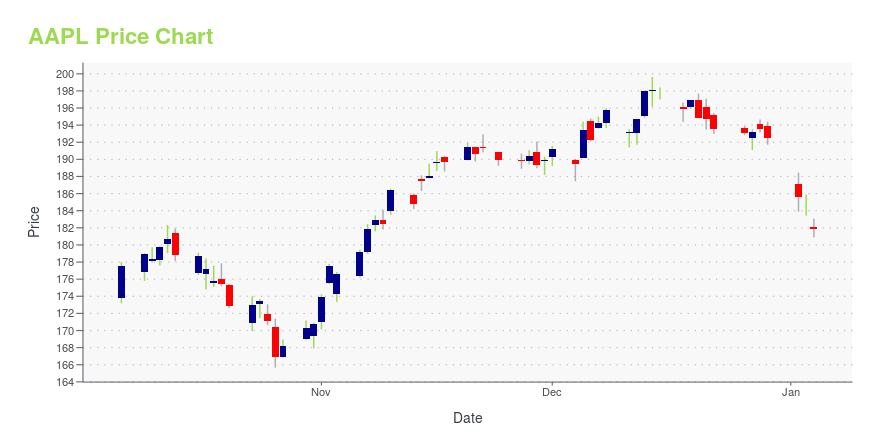
AAPL Stock Price Chart Interactive Chart >
AAPL POWR Grades
- AAPL scores best on the Quality dimension, with a Quality rank ahead of 96.98% of US stocks.
- AAPL's strongest trending metric is Growth; it's been moving down over the last 179 days.
- AAPL's current lowest rank is in the Value metric (where it is better than 16.56% of US stocks).
AAPL Stock Summary
- AAPL has a market capitalization of $2,702,820,151,680 -- more than approximately 100% of US stocks.
- APPLE INC's capital turnover -- a measure of revenue relative to shareholder's equity -- is better than 93.13% of US listed stocks.
- AAPL's went public 37.42 years ago, making it older than 93.61% of listed US stocks we're tracking.
- Stocks with similar financial metrics, market capitalization, and price volatility to APPLE INC are MSFT, GOOGL, AMZN, NVDA, and BRK.B.
- AAPL's SEC filings can be seen here. And to visit APPLE INC's official web site, go to www.apple.com.
AAPL Valuation Summary
- In comparison to the median Technology stock, AAPL's price/sales ratio is 173.08% higher, now standing at 7.1.
- AAPL's price/earnings ratio has moved up 985.4 over the prior 243 months.
Below are key valuation metrics over time for AAPL.
Stock | Date | P/S | P/B | P/E | EV/EBIT |
---|---|---|---|---|---|
AAPL | 2023-05-22 | 7.1 | 44.1 | 29.0 | 24.5 |
AAPL | 2023-05-19 | 7.2 | 44.3 | 29.2 | 24.7 |
AAPL | 2023-05-18 | 7.1 | 44.3 | 29.2 | 24.6 |
AAPL | 2023-05-17 | 7.1 | 43.7 | 28.8 | 24.3 |
AAPL | 2023-05-16 | 7.0 | 43.5 | 28.7 | 24.2 |
AAPL | 2023-05-15 | 7.0 | 43.5 | 28.7 | 24.2 |
AAPL Growth Metrics
- Its 3 year net income to common stockholders growth rate is now at 78.3%.
- Its 3 year cash and equivalents growth rate is now at -26.03%.
- Its 3 year price growth rate is now at 199.54%.

The table below shows AAPL's growth in key financial areas (numbers in millions of US dollars).
Date | Revenue | Operating Cash Flow | Net Income to Common Stock |
---|---|---|---|
2022-12-31 | 387,537 | 109,190 | 95,171 |
2022-09-30 | 394,328 | 122,151 | 99,803 |
2022-06-30 | 387,542 | 118,224 | 99,633 |
2022-03-31 | 386,017 | 116,426 | 101,935 |
2021-12-31 | 378,323 | 112,241 | 100,555 |
2021-09-30 | 365,817 | 104,038 | 94,680 |
AAPL's Quality Factors
The “Quality” component of the POWR Ratings focuses on 31 different factors of a companies fundamentals and operational strength. Here are some key insights as we drill into the specifics of these quality attributes.- AAPL has a Quality Grade of B, ranking ahead of 87.57% of graded US stocks.
- AAPL's asset turnover comes in at 1.066 -- ranking 18th of 83 Computers stocks.
- VRNT, ALLT, and PAR are the stocks whose asset turnover ratios are most correlated with AAPL.
The table below shows AAPL's key quality metrics over time.
Period | Asset Turnover | Gross Margin | ROIC |
---|---|---|---|
2021-09-25 | 1.066 | 0.418 | 0.353 |
2021-06-26 | 1.032 | 0.410 | 0.332 |
2021-03-27 | 0.977 | 0.399 | 0.297 |
2020-12-26 | 0.894 | 0.388 | 0.252 |
2020-09-26 | 0.843 | 0.382 | 0.225 |
2020-06-27 | 0.832 | 0.382 | 0.229 |
AAPL Price Target
For more insight on analysts targets of AAPL, see our AAPL price target page. And for a list of of all stocks sorted by upside potential based on analyst target price, see our Top Price Target page.
Average Price Target | $167.92 | Average Broker Recommendation | 1.43 (Moderate Buy) |
Apple Inc. (AAPL) Company Bio
Founded in 1977 by Steven Paul Jobs, Ronald Gerald Wayne, and Stephen G. Wozniak, Apple Inc. is the world’s largest technology company. Apple's hardware products include the iPhone smartphone, the iPad tablet computer, the Mac personal computer, the iPod portable media player, the Apple Watch smartwatch, the Apple TV digital media player, the AirPods wireless earbuds, the AirPods Max headphones, and the HomePod smart speaker line. Software offerings includes iOS, iPadOS, macOS, watchOS, and tvOS operating systems, the iTunes media player, the Safari web browser, the Shazam music identifier, and the iLife and iWork creativity and productivity suites, as well as professional applications like Final Cut Pro X, Logic Pro, and Xcode. Its online services include the iTunes Store, the iOS App Store, Mac App Store, Apple Arcade, Apple Music, Apple TV+, iMessage, and iCloud. Other services include Apple Store, Genius Bar, AppleCare, Apple Pay, Apple Pay Cash, and Apple Card. Apple is considered one of the Big Five companies in the U.S. information technology industry, along with Amazon, Alphabet, Microsoft, and Facebook.
Latest AAPL News From Around the Web
Below are the latest news stories about APPLE INC that investors may wish to consider to help them evaluate AAPL as an investment opportunity.
Apple: Chart Of The WeekIn this video, I take a look at Apple's stock, but from a more-bearish point of view. The chart is strong, but momentum is starting to slow down. |
Short-Term Pain Setting Up Long-Term Stock Market GainsLast year, energy stocks were the darlings while mega-cap tech companies were crushed. This year, energy and small-cap equities have been dead weight while mega-cap technology stocks have regained their leadership. |
Reflections On Investing: US Tech Stocks – The Big Get BiggerFive US tech companies account for 25% of the S&P 500 market cap. This video discusses the resurgence of big US tech and what it means for investors. |
Benefit From The Tech Rally And Get IncomeFor months, the share prices of most stocks have been in the doldrums or worse. Large-cap tech stocks have been the exception. Let’s check how a couple of covered call ETFs have performed compared to the most popular tech stock ETF. |
Why AAPL Stock Is Low-Hanging Fruit on Any WeaknessIf you own AAPL stock today, there's no need to make a hasty exit. |
AAPL Price Returns
1-mo | 4.84% |
3-mo | 22.42% |
6-mo | 20.28% |
1-year | N/A |
3-year | 127.61% |
5-year | 297.84% |
YTD | 37.12% |
2022 | -26.31% |
2021 | 34.65% |
2020 | 82.06% |
2019 | 88.96% |
2018 | -5.39% |
AAPL Dividends
Ex-Dividend Date | Type | Payout Amount | Change | ||||||
---|---|---|---|---|---|---|---|---|---|
Loading, please wait... |
Continue Researching AAPL
Want to do more research on Apple Inc's stock and its price? Try the links below:Apple Inc (AAPL) Stock Price | Nasdaq
Apple Inc (AAPL) Stock Quote, History and News - Yahoo Finance
Apple Inc (AAPL) Stock Price and Basic Information | MarketWatch
Loading social stream, please wait...