

The stock market declined 3.5% this week; by far the worst 5-day performance of the year. Investors are now wondering if this a buying opportunity, or the start of a larger decline?
The proximate cause for the selling is the unraveling of the trade deal with China, which is now resulting in higher tariffs. But after a nearly straight line rally of 25% from the December low, the market was due for a rest and some sort of pullback.
To figure out if this is a buying opportunity, let’s analyze some of the basic technical, sentiment and market dynamic measures.
First, it’s good to remember that over the past 50 years, the market typically averages 4 drawdowns of 5% or more during the year. So, at this point, given it has only had 1 prior pullback of 3.5% during March, the current decline would still leave the market to have less-than-average declines.
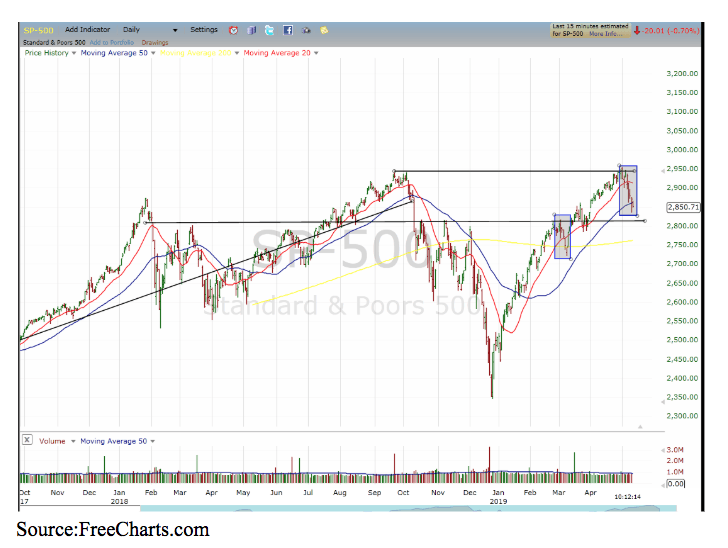
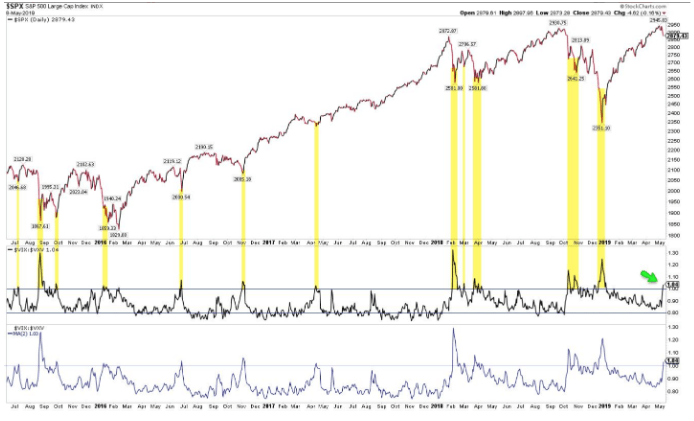
In fact, thus far, the current decline is similar to the March decline in terms of magnitude and length of time. Both occurred after big run-ups that tipped, but that initially failed to break through important resistance levels.
As the blue boxes indicate, back in March, the S&P 500 Index tipped 2800 before pulling incurring a 3.5% decline over the course of the next 5 days. This time, it tipped the all-time high at 2940 and is currently in its 5th day and down some 3.9%.
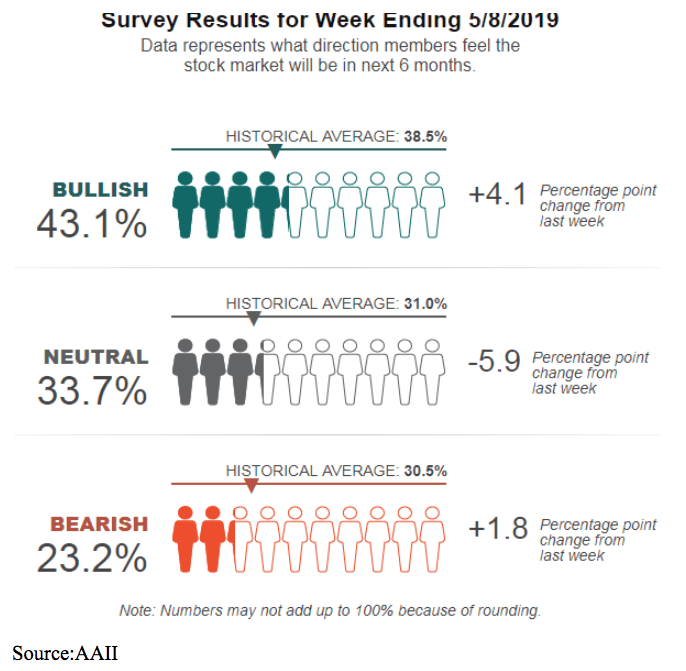
What’s also interesting to note is last week investor sentiment, as measured by the American Institute of Individual Investors (AAII) took a significant shift to bullishness as people moved out of the neutral camp.
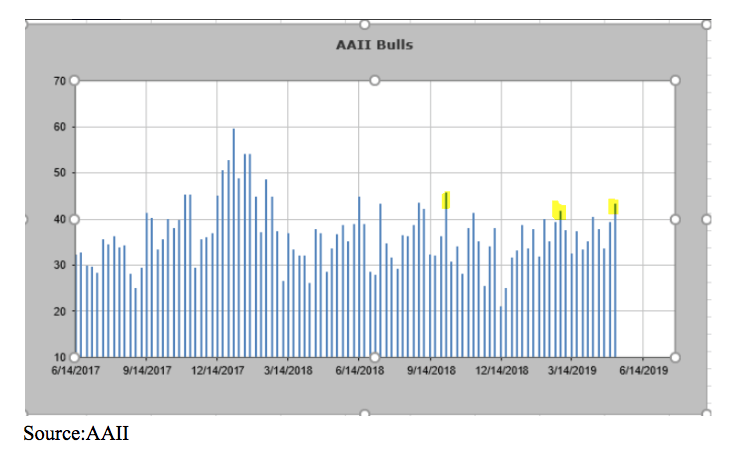
Bullishness heading into this week registered the highest readings since October 3rd and March 5th (highlighted); the two dates that preceded sell-offs.
One of the differences between now and March is the current decline seems to be instilling more fear in investors. At least as measured by the VIX or Volatility Index.
As you can see, the VIX futures have gone into backwardation, meaning the near-term contracts trade at a premium to the later-dated contracts. This stands in contrast to the normal term structure in which later dates trade at a premium, called contango.
This image below shows the sharp shift in term structure to today’s backwardation (black line) from last week’s normal contango (blue line).
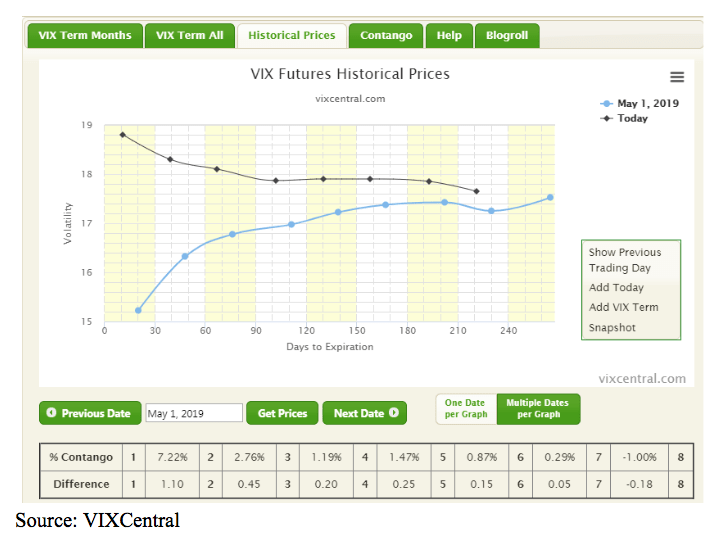
This stands in contrast to last March when even on 3/8 which marked the climax of selling, the VIX term structure remained in contango.
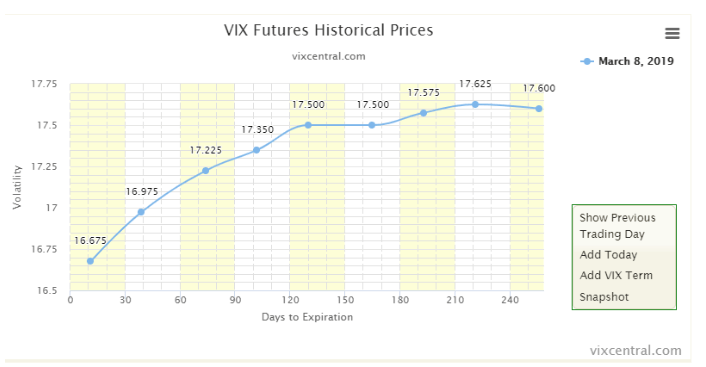
Backwardation is a sign of fear or great uncertainty and has in the past often accompanied important market lows. But, as you can see, it can also get much more extreme than current levels before marking a bottom.
So, all told, it seems as the market approaches a 5% pullback, which would align with support near the S&P 500 Index 2820 level, we have the ingredients in which this could turn into a buyable dip.
About the Author: Steve Smith

Steve has more than 30 years of investment experience with an expertise in options trading. He’s written for TheStreet.com, Minyanville and currently for Option Sensei. Learn more about Steve’s background, along with links to his most recent articles. More...
9 "Must Own" Growth Stocks For 2019
Get Free Updates
Join thousands of investors who get the latest news, insights and top rated picks from StockNews.com!
Top Stories on StockNews.com

Best & Worst Performing Mega Cap Stocks for July 11, 2025
AEXAY leads the way today as the best performing mega cap stock, closing up 34.37%.
Best & Worst Performing Mega Cap Stocks for July 10, 2025
AEXAY leads the way today as the best performing mega cap stock, closing up 13.49%.
Best & Worst Performing Mega Cap Stocks for July 9, 2025
AEXAY leads the way today as the best performing mega cap stock, closing up 13.49%.
Best & Worst Performing Mega Cap Stocks for July 8, 2025
AEXAY leads the way today as the best performing mega cap stock, closing up 13.49%.