

A resistance level has formed in the chart of the world’s largest bauxite miner and alumina refiner by production volume, Alcoa (AA).
Alcoa reported earnings last week and beat EPS and revenue estimates. As a result the stock has been trading higher.
Take a look at the 1-year chart of Alcoa (AA - Get Rating) below with added notations:
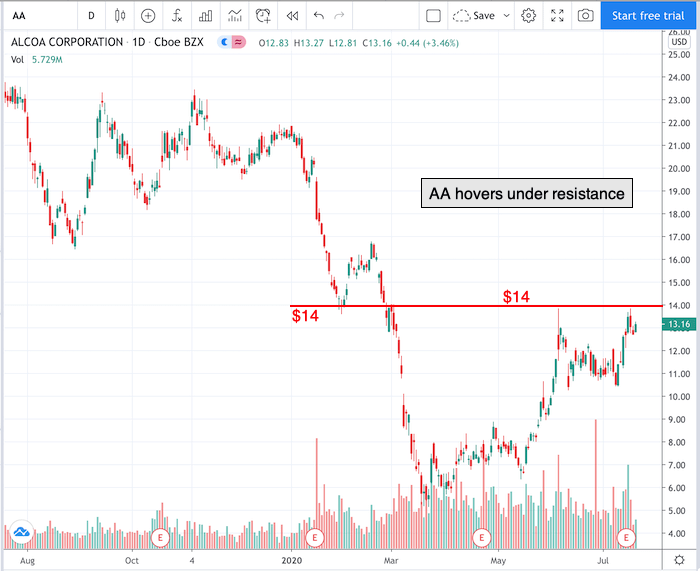
Chart of AA provided by TradingView
During the past two months, AA has formed a key level of resistance at $14 (red). The stock has tested that $14 level twice since the beginning of June.
A solid close above that $14 level should lead to higher prices for AA. Therefore a long trade could be entered on a breakthrough of that level.
Keep an eye on commodity prices as AA’s profits are closely tied to prevailing commodity prices along the aluminum supply chain.
Have a good trading day!
Good luck!
Christian Tharp, CMT
@cmtstockcoach
Want More Great Investing Ideas?
9 “BUY THE DIP” Growth Stocks for 2020
Newly REVISED 2020 Stock Market Outlook
7 “Safe-Haven” Dividend Stocks for Turbulent Times
AA shares were trading at $13.28 per share on Wednesday morning, up $0.12 (+0.91%). Year-to-date, AA has declined -38.26%, versus a 2.27% rise in the benchmark S&P 500 index during the same period.
About the Author: christian

Christian is an expert stock market coach at the Adam Mesh Trading Group who has mentored more than 4,000 traders and investors. He is a professional technical analyst that is a certified Chartered Market Technician (CMT), which is a designation awarded by the CMT Association. Christian is also the author of the daily online newsletter Todays Big Stock. More...
More Resources for the Stocks in this Article
| Ticker | POWR Rating | Industry Rank | Rank in Industry |
| AA | Get Rating | Get Rating | Get Rating |


