

Popular homestay provider Airbnb, Inc. (ABNB - Get Rating) reported robust third-quarter financials on the backs of a record summer travel season and international expansion. For the fiscal third quarter (ended September 30), ABNB’s revenue increased 17.8% year-over-year to $3.40 billion, compared with the average analyst estimate of $3.37 billion.
However, the company is seeing heightened volatility in the fourth quarter as uncertain economic conditions and geopolitical issues pressure the company’s operations. ABNB projects fourth-quarter revenue between $2.13 billion and $2.17 billion, lower than average analysts’ estimate of $2.18 billion.
Given this uncertain backdrop, let’s look at the trends of ABNB’s key financial metrics to understand why it could be prudent to watch and wait for a better entry point in the stock.
ABNB’s Financial Performance Trend Analysis
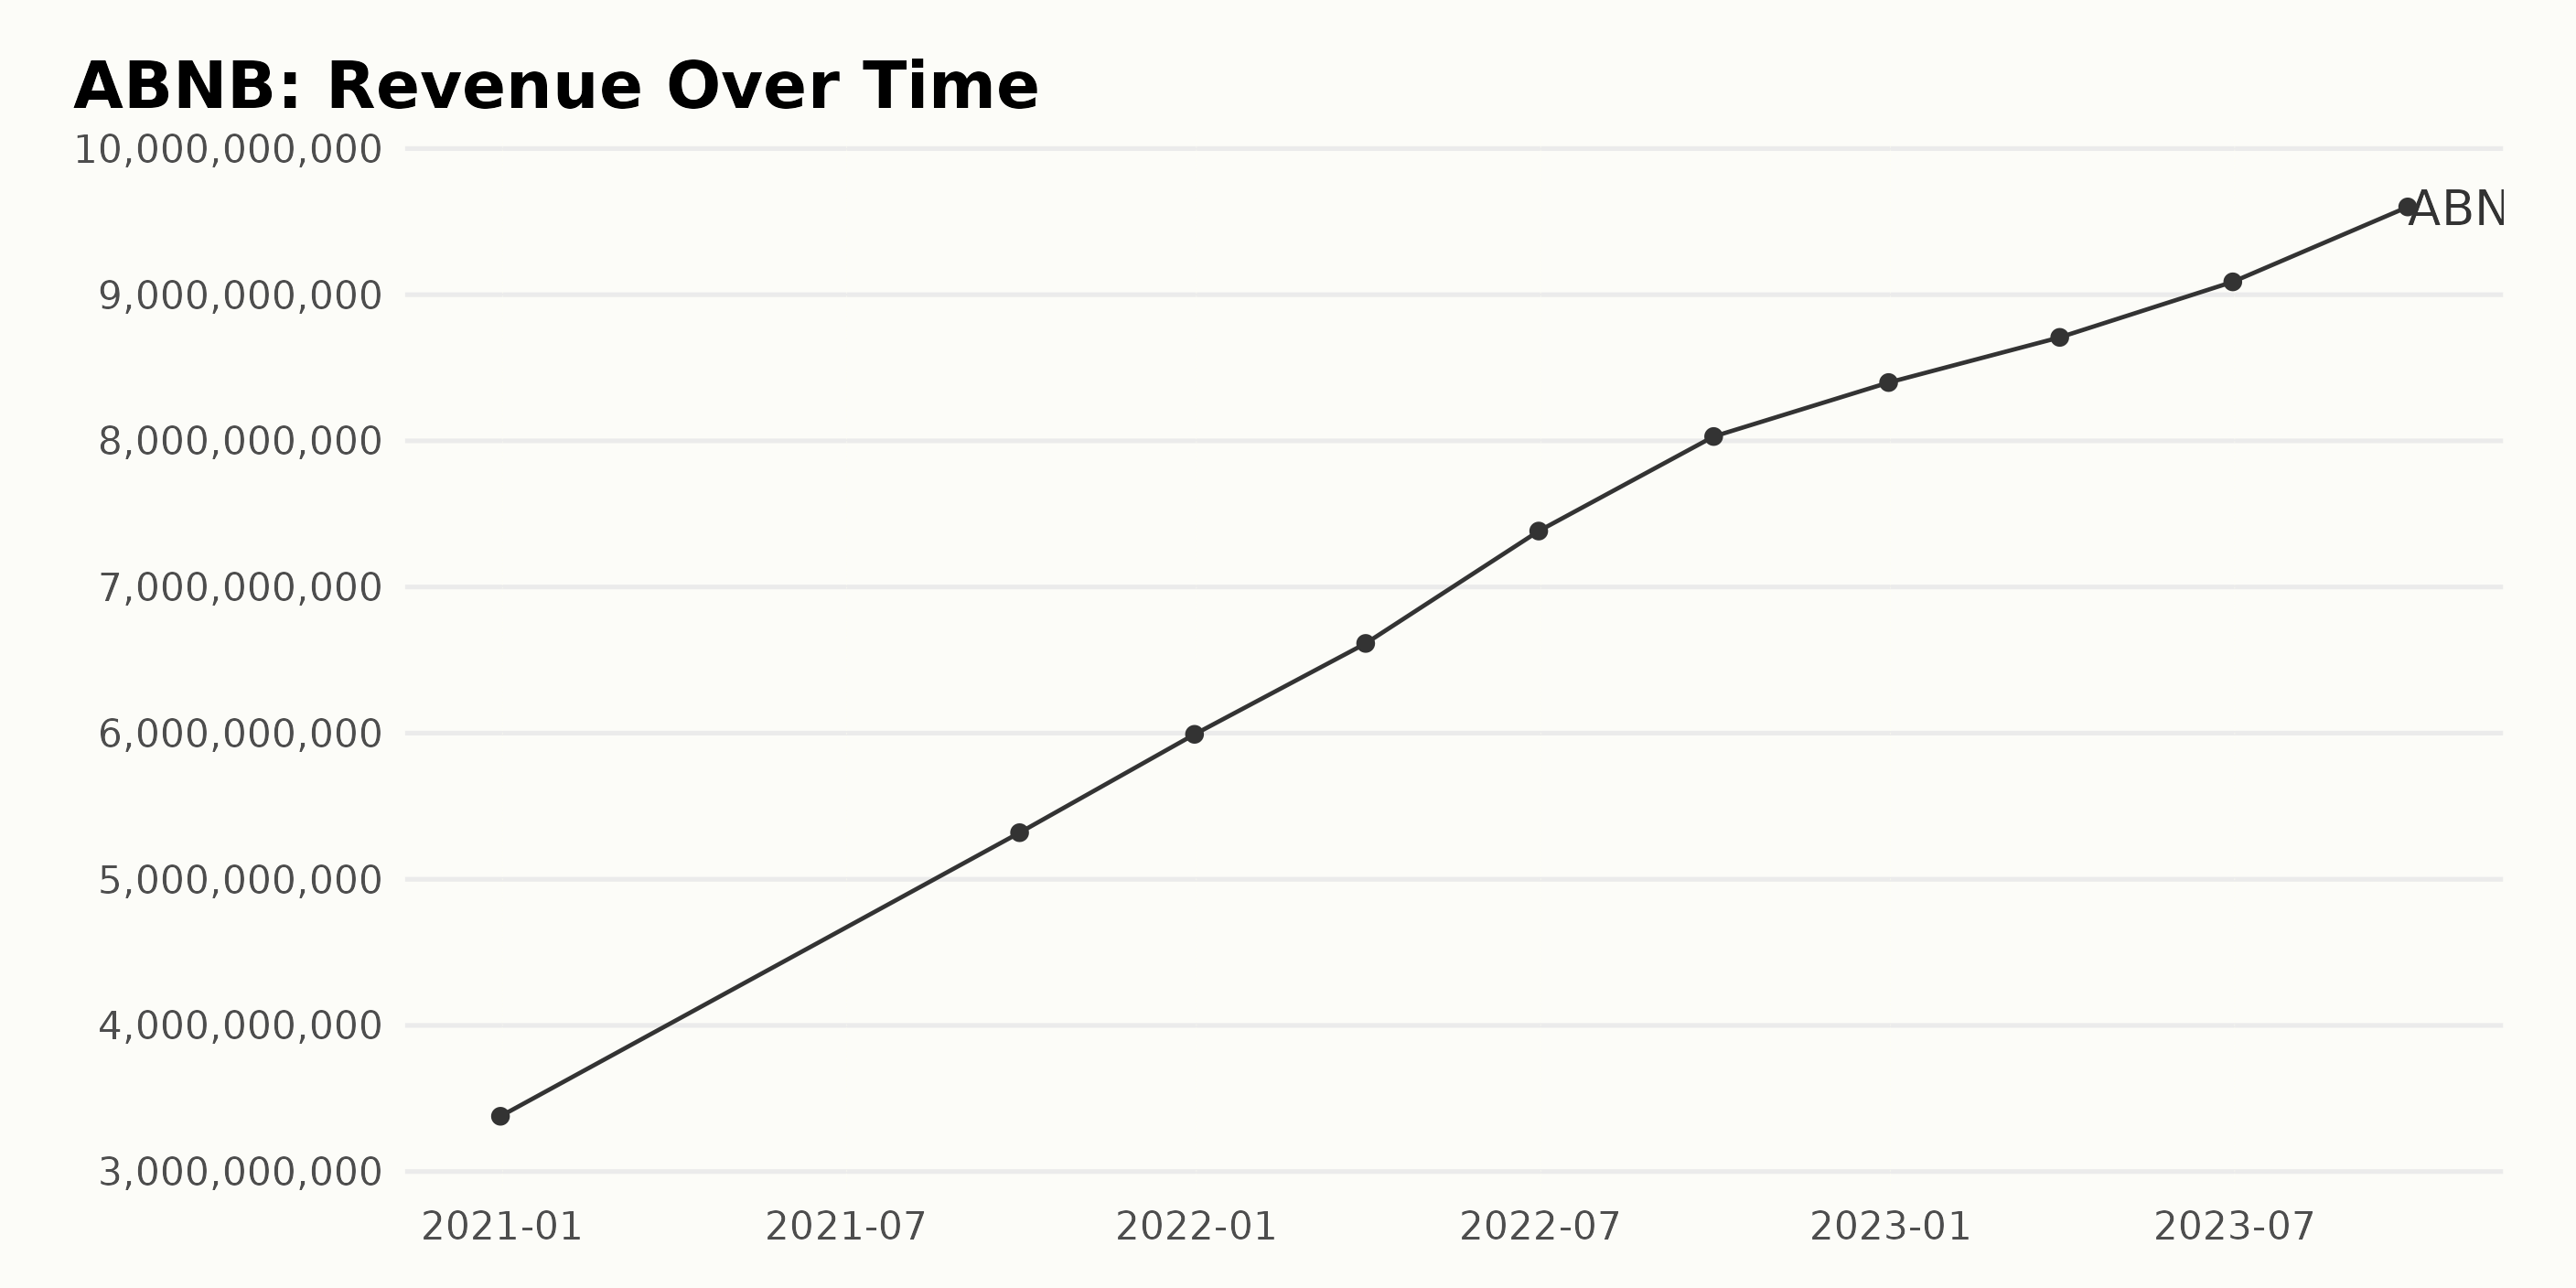
The trailing-12-month revenue for ABNB shows a clear upward trend from December 2020 to September 2023. The data reveals several key trends and fluctuations:
- Starting at a revenue of $3.38 billion in December 2020, there is significant growth over the given period.
- The revenue increased consistently through 2021, ending September 2021 at $5.32 billion and demonstrating a noticeable growth pattern.
- This trend of growth continued into 2022, with periodic increases in revenue reported each quarter: $6.61 billion in March, $7.38 billion in June, $8.03 billion in September, ending the year at $8.4 billion in December.
- Through 2023, this positive growth persists yet again, reaching a high of $9.6 billion in September 2023.
Overall, the total growth from December 2020 ($3.38 billion) to September 2023 ($9.6 billion) represents a significant increase in revenue. This results in a growth rate of approximately 184%, illustrating a robust performance by ABNB.
During this period, there are no drastic dips suggestive of instability, with the revenue stream increasing relatively progressively. The most recent data point, as of September 2023, shows a revenue figure of $9.6 billion, the highest in the series, encouraging for ABNB’s financial trajectory.
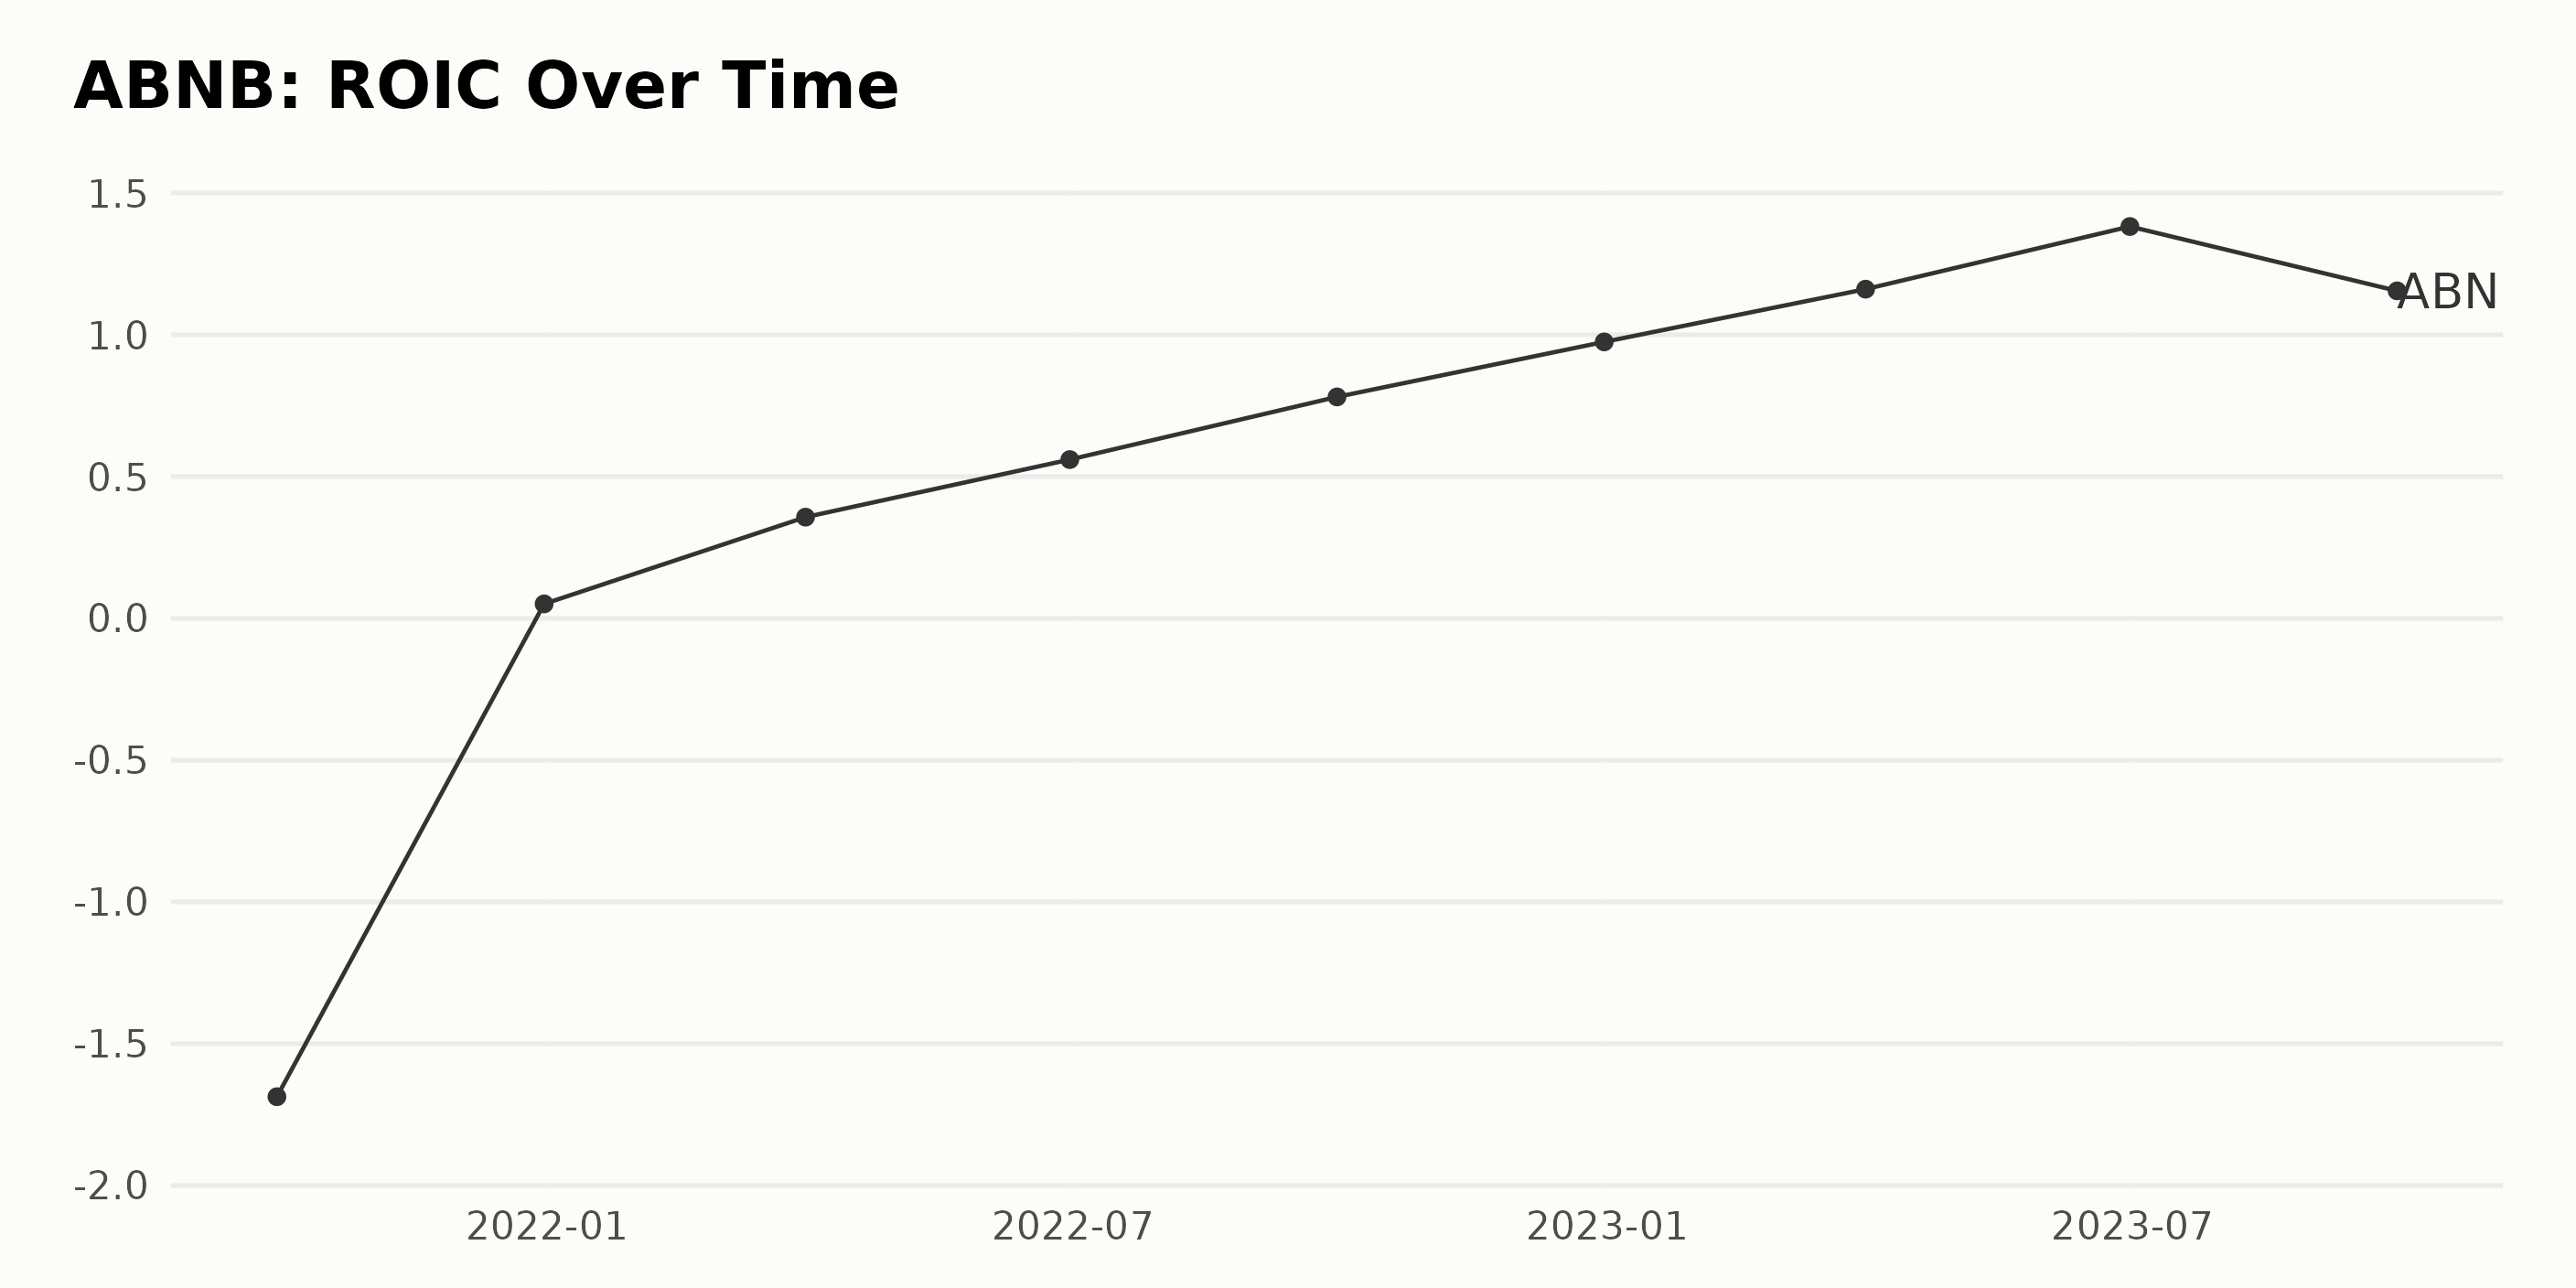
The ROIC data series for ABNB showcases an upward trajectory with occasional fluctuations.
- On September 30, 2021, the ROIC was recorded at -1.69.
- By December 31, 2021, the ROIC had improved to 0.051.
- In the first quarter of 2022, the value further increased to 0.36 on March 31.
- Following this trend, it rose to 0.56 by June 30, 2022, and reached 0.78 on September 30, 2022.
- The upward trend continued till December 31, 2022, with a ROIC of 0.98 recorded.
- Starting from 2023, the figure experienced an amplified surge, reaching 1.16 on March 31 and reaching its maximum of 1.38 on June 30.
- However, the strong growth met resistance as a fall on September 30, 2023, brought the ROIC down to 1.16.
Focusing on the most recent figures, it is evident that the ROIC peaked in June 2023 before falling sharply by September 2023. Nevertheless, since the initial measurement in September 2021, ABNB has experienced remarkable growth in ROIC, as reflected in the growth rate calculation from -1.69 to 1.16. This represents a substantial turnaround of more than 168.6% over the period.
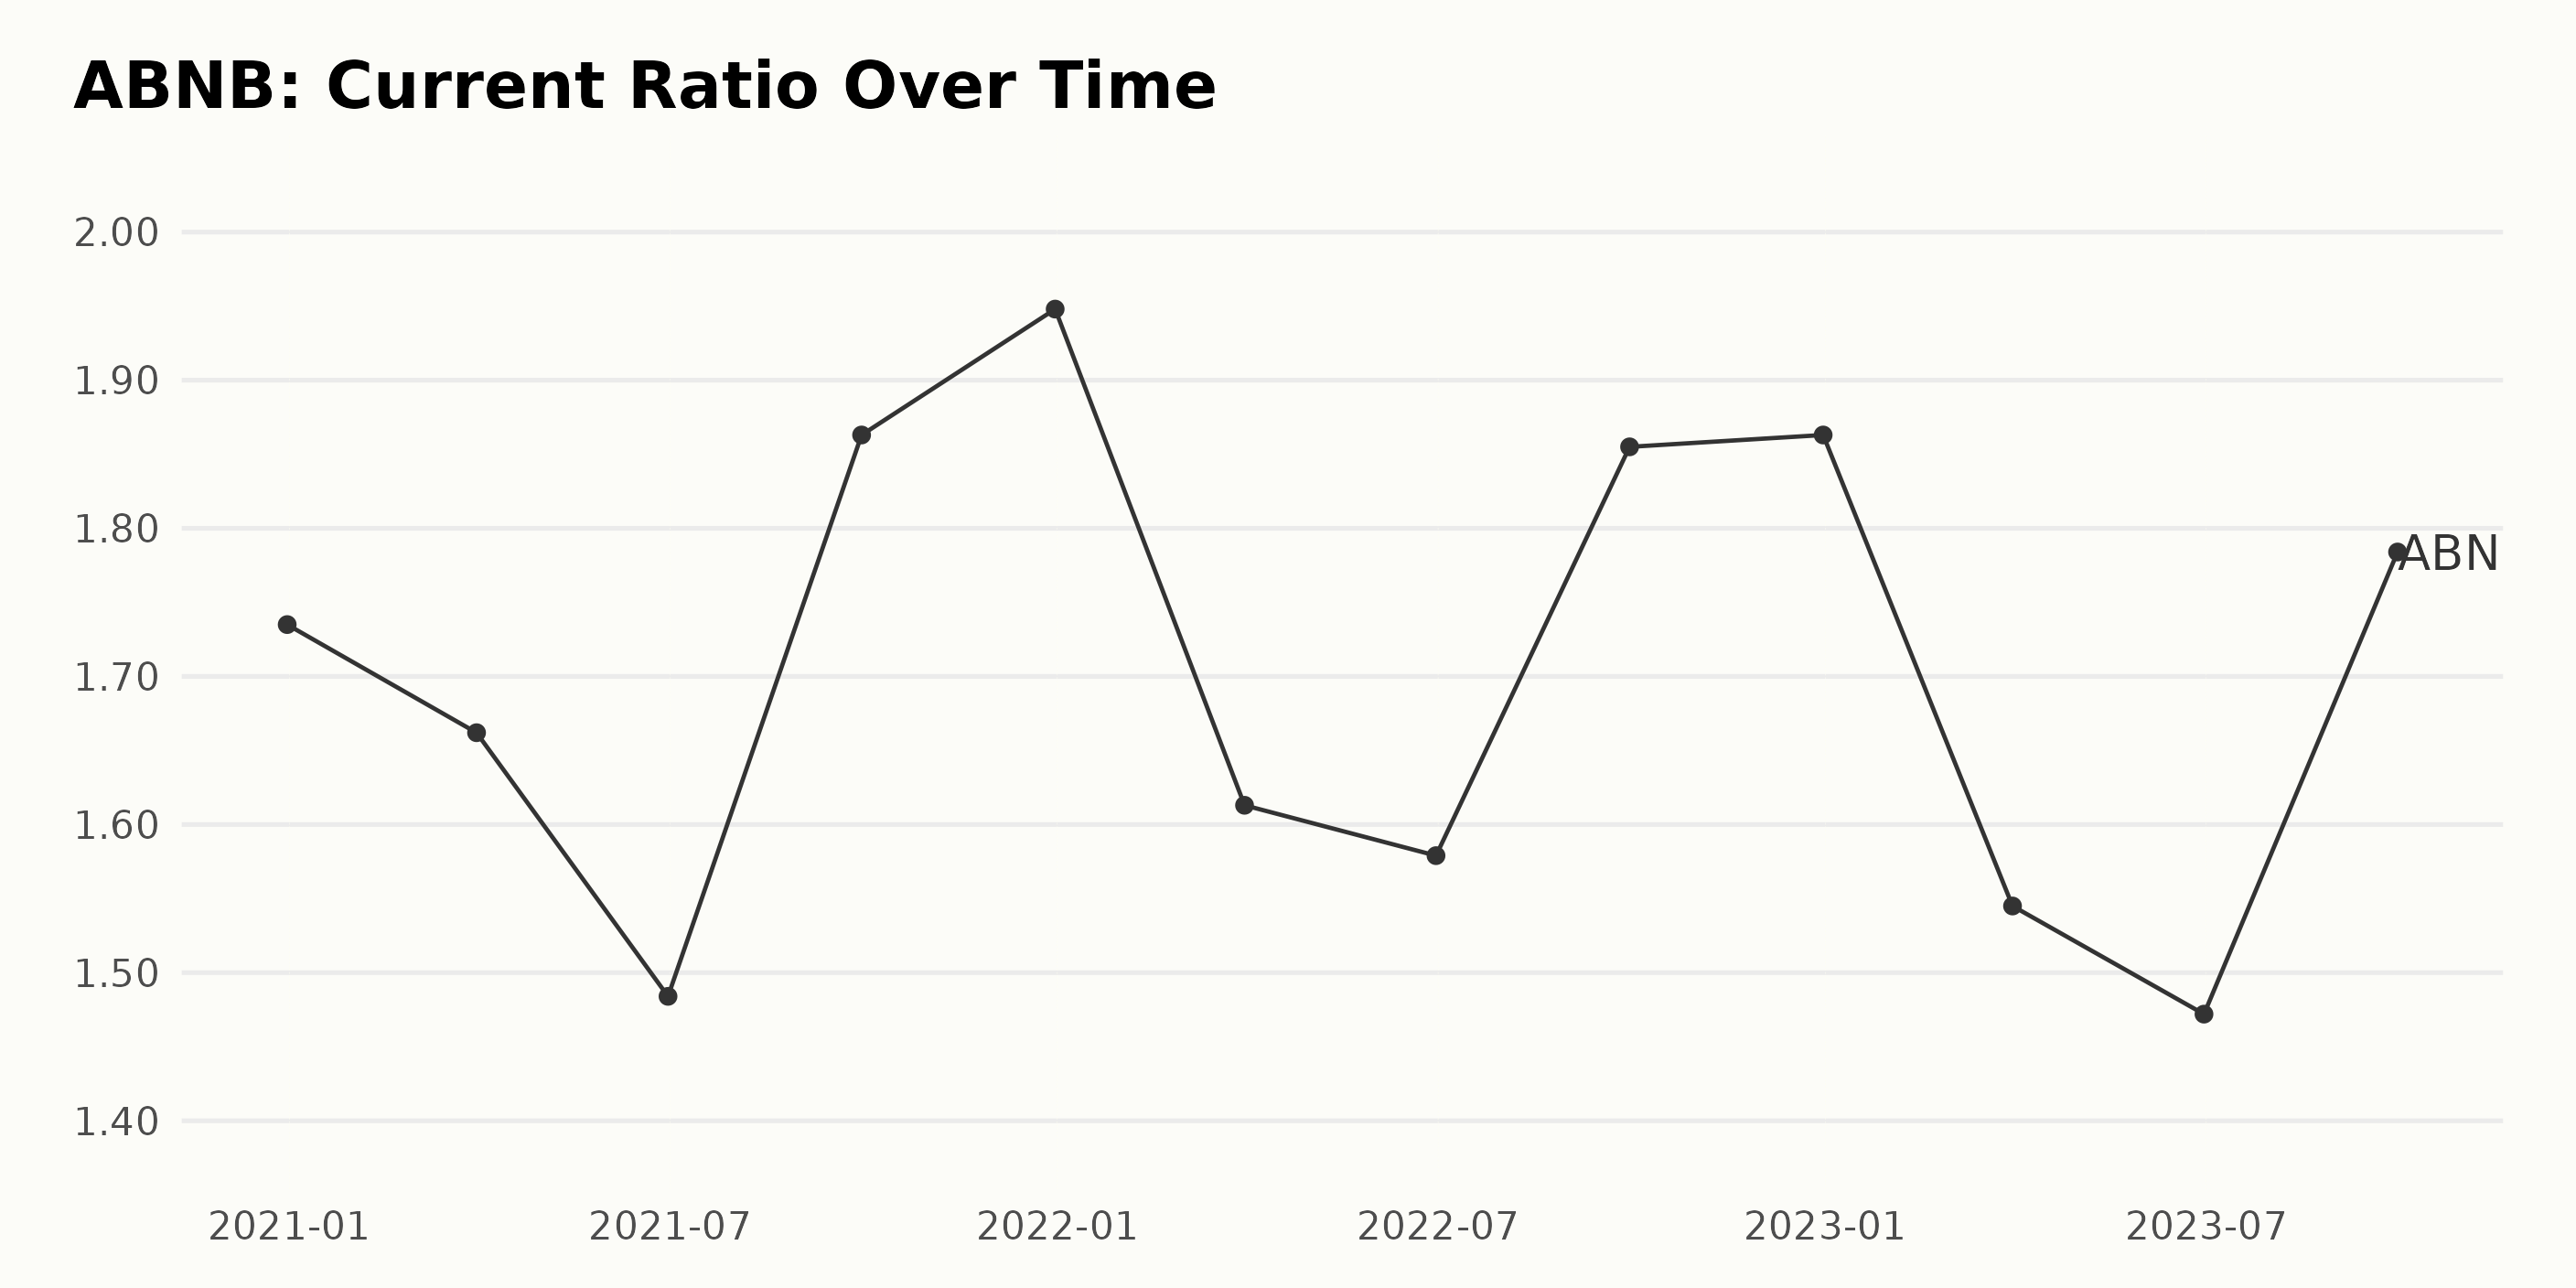
Here’s a summary of the trend and fluctuations in the current ratio of ABNB:
- Starting from December 2020, ABNB reported a current ratio of 1.73.
- Throughout the next year, there were somewhat moderate fluctuations in the current ratio, with a notable trough by June 2021 at 1.48, followed by a significant peak at the end of the same year to 1.95.
- Similarly, the year 2022 saw fluctuations in ABNB’s current ratio, decreasing to 1.58 by June but peaking back by the year-end to 1.86.
- In 2023, ABNB experienced an initial dip in their current ratio, reaching a low of 1.47 by June before rebounding to 1.78 by September.
This data shows some degree of volatility in ABNB’s current ratio, with a pattern of rise and decline that seems to repeat annually. However, there is a general downward trend, as supported by the calculated growth rate.
From the first value in December 2020 (1.73) to the most recent value in September 2023 (1.78), we can calculate a rough growth rate of about -7%. The latest available data point from September 2023 shows a current ratio of 1.78, indicating a substantial decrease compared to the value of 1.95 at the end of the 2021 period, which was the highest in this series.
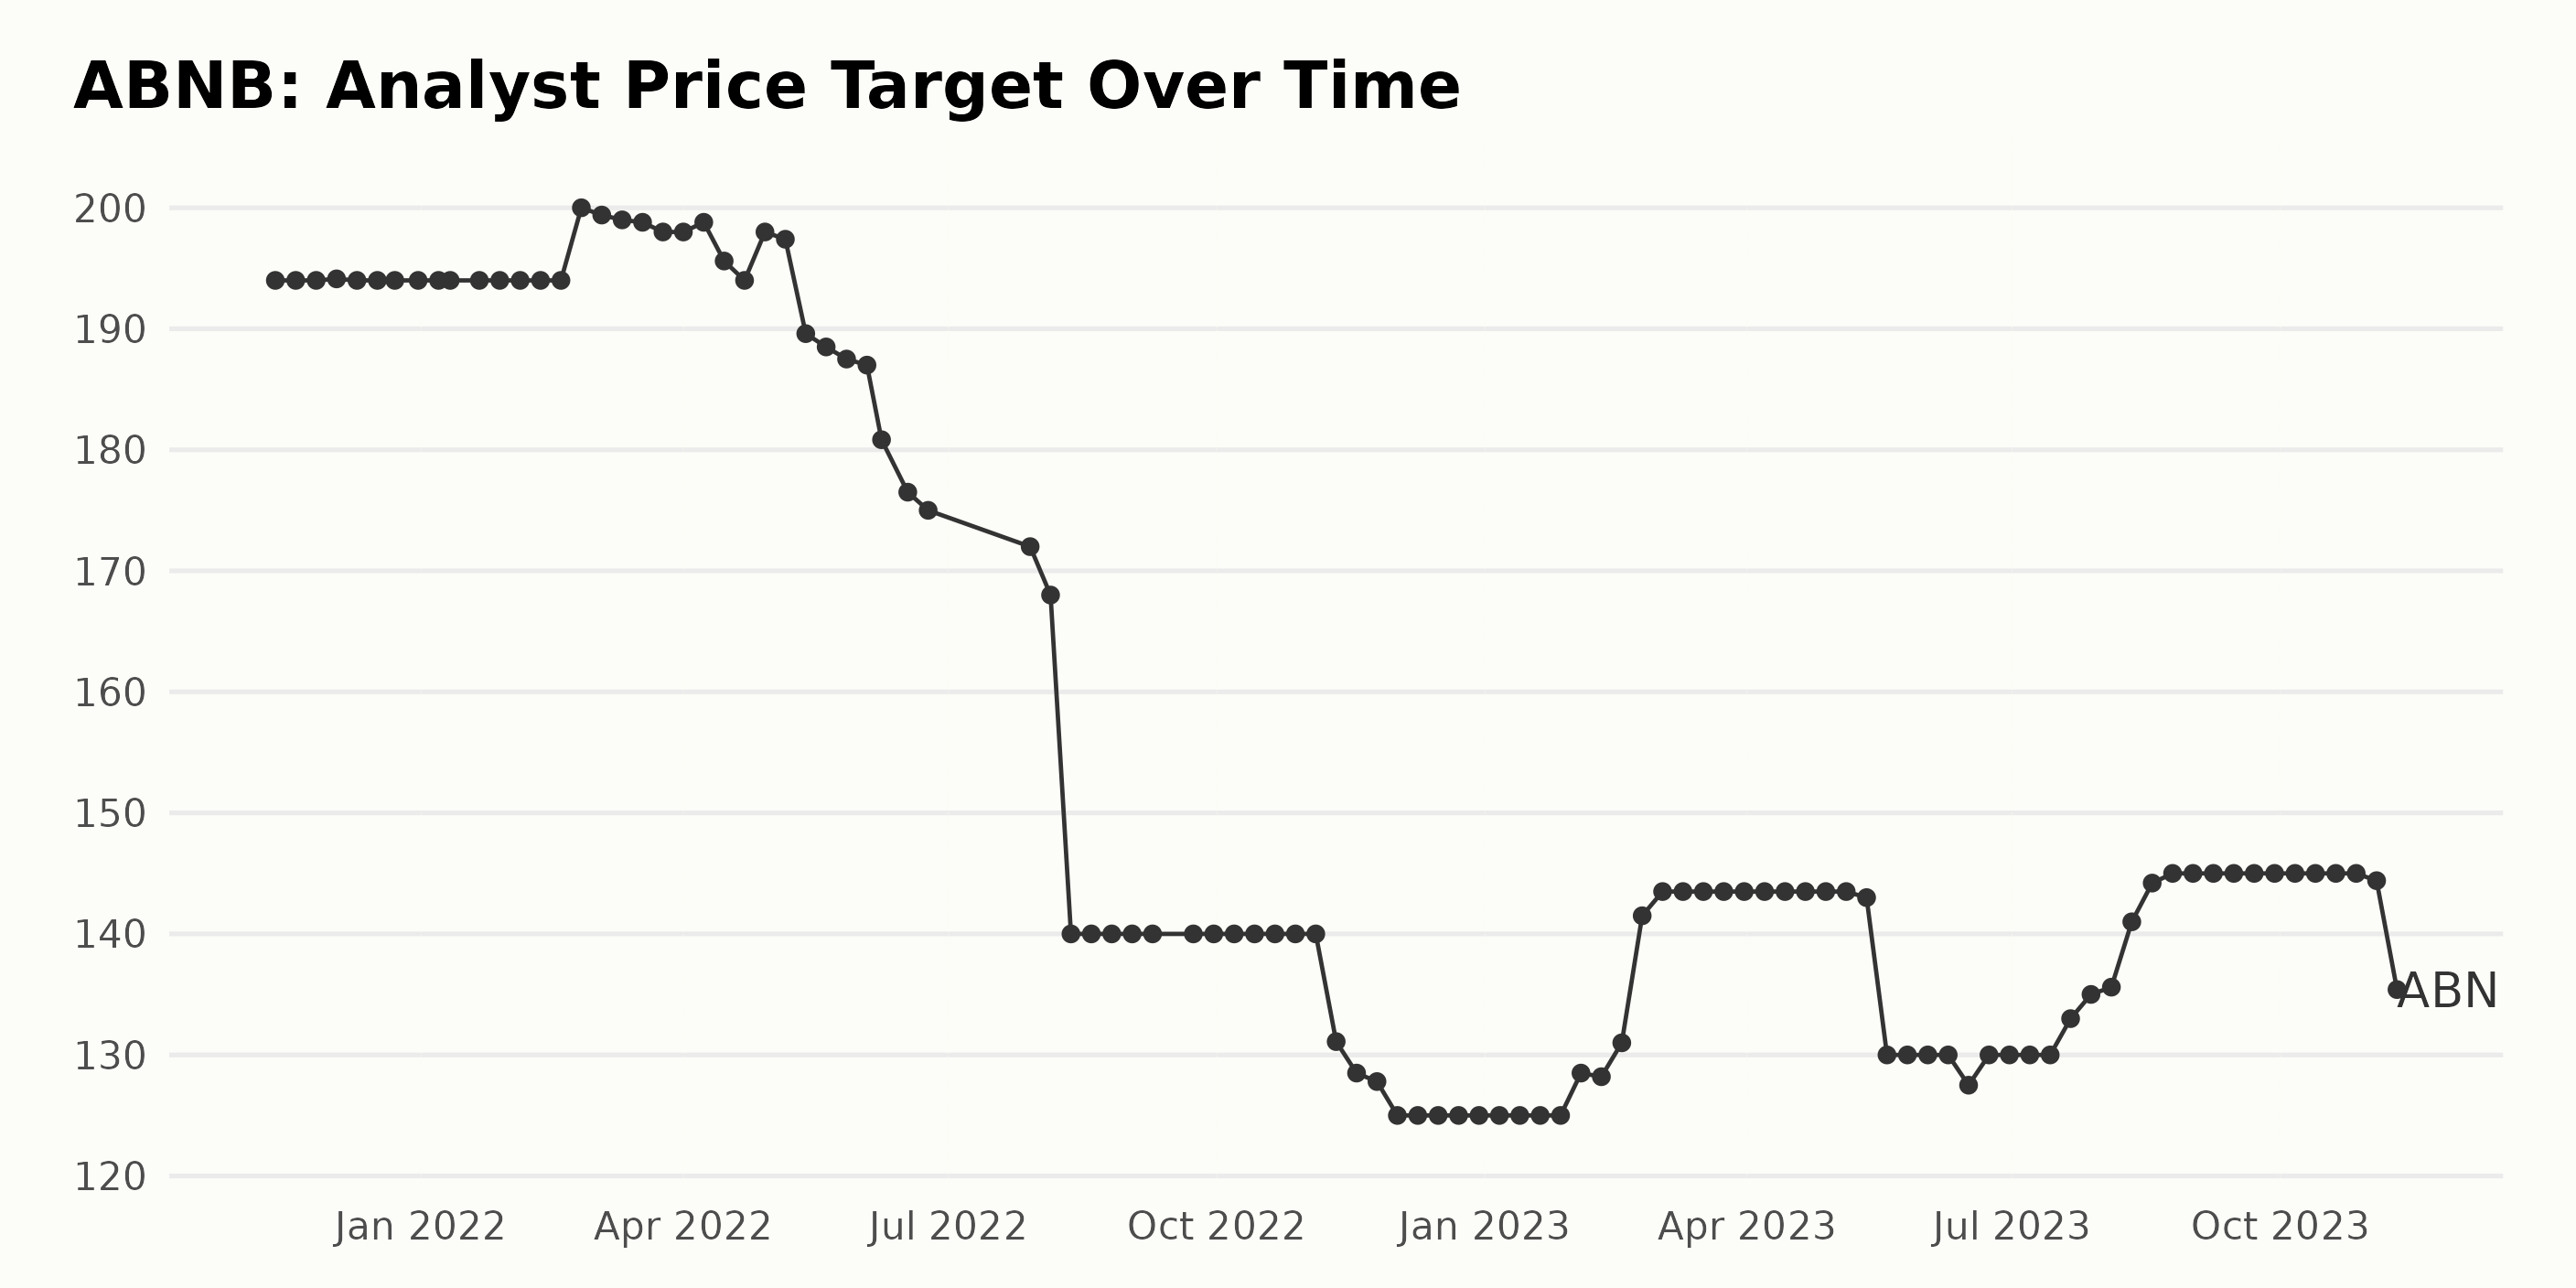
The Analyst Price Target (APT) for ABNB had undergone several fluctuations throughout the period, illustrating moderate volatility in its performance. To summarize the trend:
- The APT remained relatively stable at $194 from November 12, 2021, to February 18, 2022, with minor variations with a slight peak to $200 on February 25, 2022.
- Thereafter, the APT saw a gradual decline, bottoming at $140 by August 12, 2022, and it continued to stay at $140 until November 11, 2022.
- On November 11, 2022, the APT decreased to $131.1 and continued to decline gently to reach $125 by December 2, 2022, staying stable until February 3, 2023.
- Since February 3, 2023, the APT has started to increase, reaching a peak of $143.5 on March 3, 2023, and maintaining that level until May 12, 2023. After that, there were noticeable fluctuations, with the APT dropping to $130 on May 19, 2023.
- In the recent data, from July 21, 2023, the APT rose again to reach $145 by August 25, 2023, and maintained this price until October 27, 2023.
- There was a noticeable drop to $135.4 on November 10, 2023, which was the APT’s last recorded value.
In terms of growth rate, measuring from the first value on November 12, 2021, to the last recorded value on November 10, 2023, the APT has undergone a decrease of approximately 30%. This implies that despite intermittent rises, the overall APT trajectory for ABNB has been on a gradual decline over the course of the specified period of around two years.
An Overview of ABNB’s Share Price Fluctuations from May to November 2023
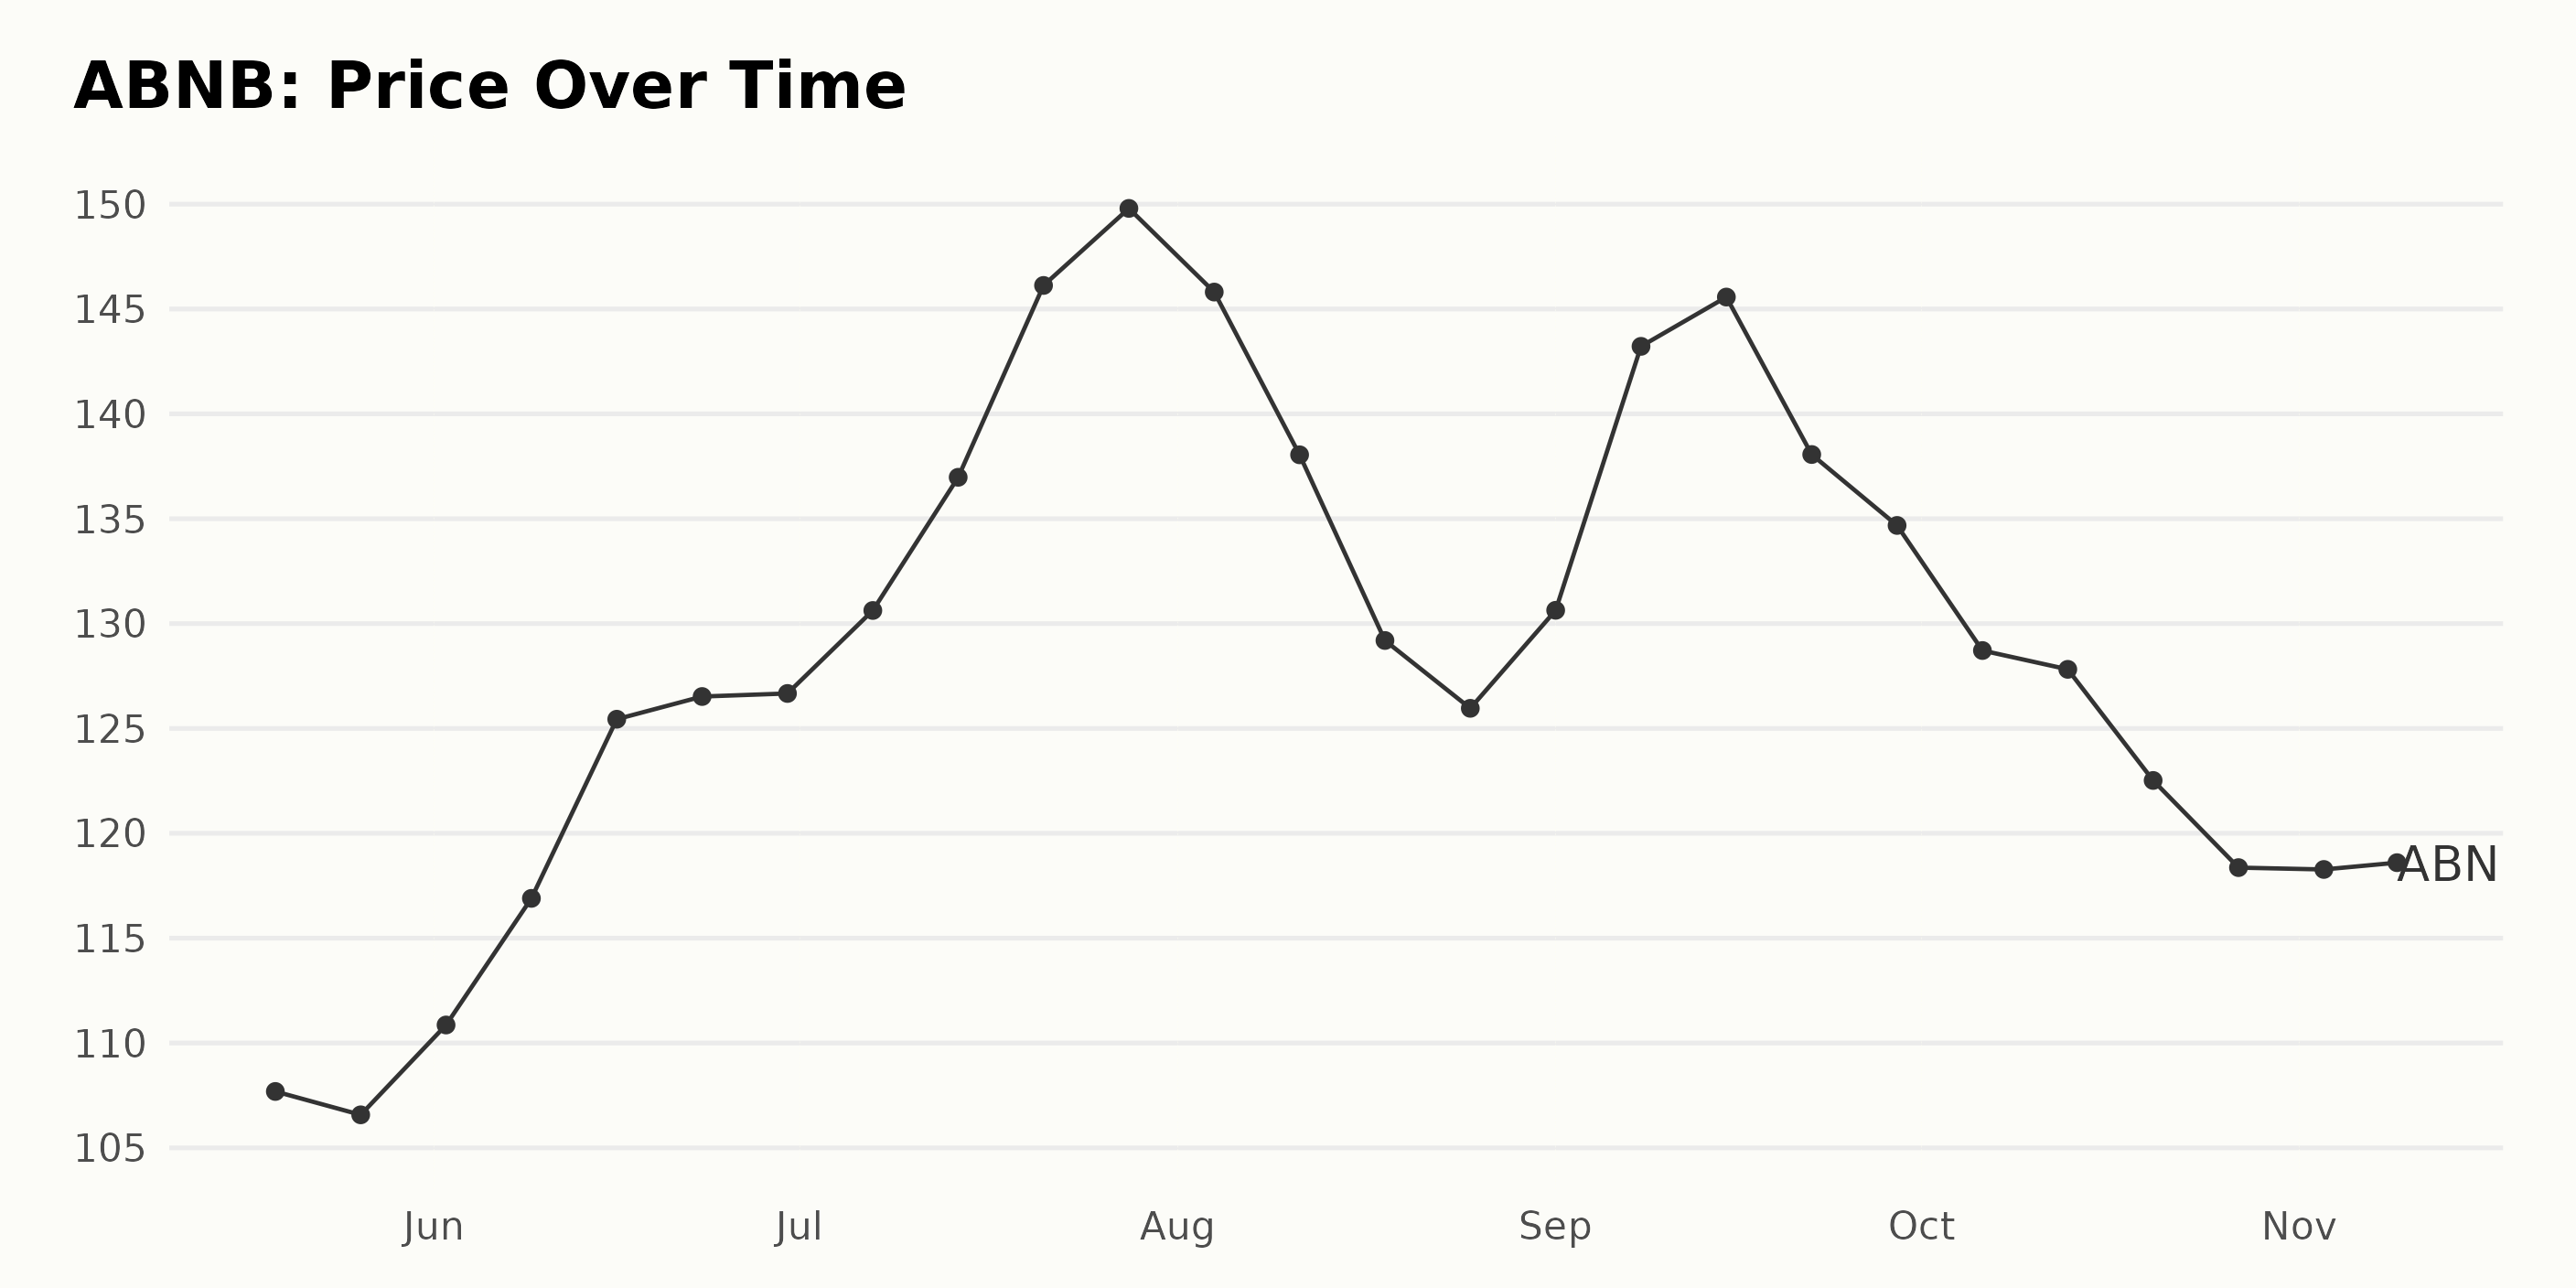
The trend of the ABNB share price from May 2023 to November 2023 can be broken down as follows:
- In May 2023, the share price witnessed a slight decrease from $107.69 on May 19 to $106.58 on May 26.
- During June 2023, there was a consistent increase observed in the share prices of ABNB. The share price rose from $110.86 on June 2 to $126.67 on June 30.
- In July 2023, the upward trend continued, with the share price reaching its peak for this period at $149.80 on July 28.
- The first half of August 2023 saw a dip in the share price from $145.81 on August 4 to $125.96 on August 25.
- In early September 2023, the share price rebounded to $145.57 but started to decline again towards the end of the month, ending at $134.68.
- Throughout October 2023, the downward trend continued, with the share price going from $128.72 at the start of the month to $118.36 by the end of October.
- Finally, in November 2023, the share price closed at $115.52 on November 9.
In terms of growth rate, there is an overall decreasing trend observed from July to November, following an initial period of growth from May to July. The growth rate accelerates from June until the end of July when it reaches its peak price.
Subsequently, the trend changes direction and decelerates from August until November. The period from May to July highlights a phase of positive growth, while the period from the end of July to November points to a decline in share price. Here is a chart of ABNB’s price over the past 180 days.
Analyzing ABNB’s Performance: Quality, Momentum, and Growth from May-November 2023
The POWR Ratings grade of ABNB, which falls under the Travel – Hotels/Resorts category of stocks consisting of 20 total entities, has shown consistent values in the past months. According to the latest data:
- The POWR grade as of November 10, 2023, is C (Neutral).
- In terms of its rank within its category, it occupies position #10, which denotes a superior rank.
This signifies its stable performance within its category. It’s also worth mentioning that from May 20, 2023, until November 9, 2023, ABNB maintained the same POWR grade C (Neutral).
The rank in the category varied slightly during these months, generally staying within mid-category rankings. During this period, the rank in the category fluctuated between #14 and #17, showing no major jumps or drops.
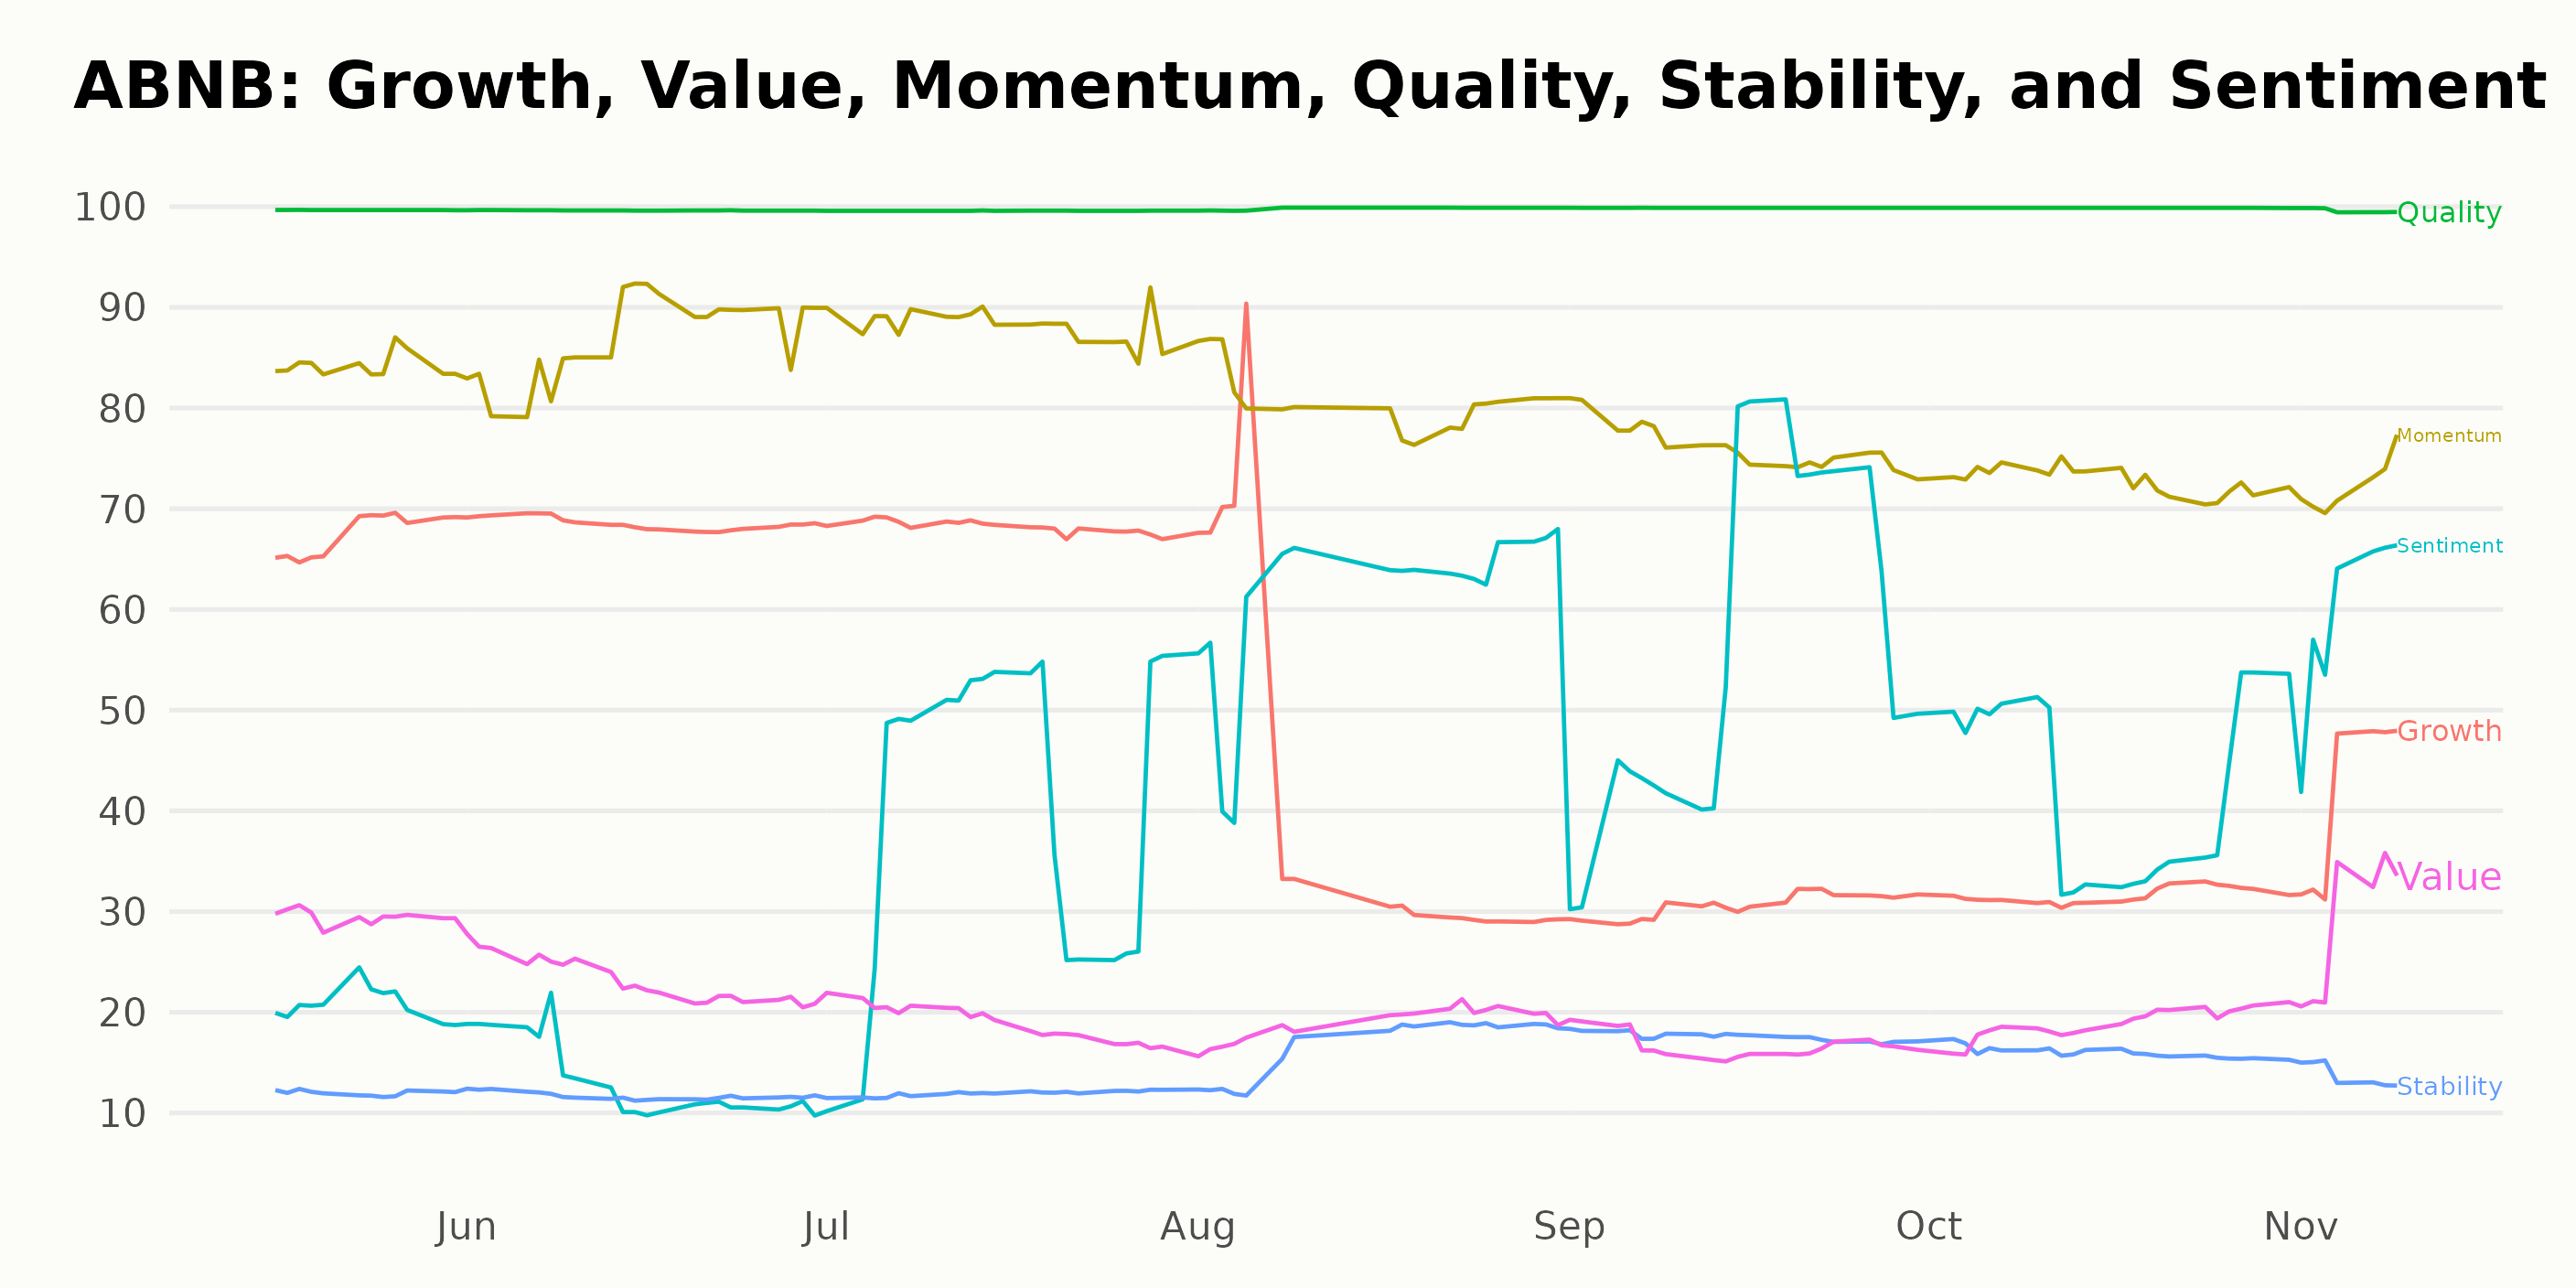
In the POWR Ratings for ABNB, we can identify the three most noteworthy dimensions: Quality, Momentum, and Growth.
Quality: The Quality dimension for ABNB maintains the highest possible rating throughout all the given time frames. Consistently rated at 100, it indicates that the company’s financial health is solid and robust from May 2023 to November 2023.
Momentum: Momentum is another high-ranking dimension for ABNB. Starting at a strong 84 in May 2023, the rating sees a steady increase to reach 88 in July 2023. Despite a slight downturn witnessed as it scored 73 in October 2023, this quickly rebounded to 72 by November 9, 2023. This suggests a slightly fluctuating yet generally positive market trend for ABNB during this period.
Growth: Lastly, the Growth dimension presents an interesting trajectory. ABNB’s Growth begins with a 67 out of 100 rating in May 2023, modestly peaking at 69 in June 2023. From there, it vacillates downward to settle at 41 by November 9, 2023. The consistent change in Growth highlights that ABNB experienced some varying degrees of growth during these months.
How does Airbnb, Inc. (ABNB) Stack Up Against its Peers?
Other stocks in the Travel – Hotels/Resorts sector that may be worth considering are Genting Berhad (GEBHY - Get Rating), Genting Singapore Limited (GIGNY - Get Rating), and InterContinental Hotels Group PLC (IHG - Get Rating) – they have better POWR Ratings. Click here to see more Travel – Hotels/Resorts stocks.
What To Do Next?
43 year investment veteran, Steve Reitmeister, has just released his 2024 market outlook along with trading plan and top 11 picks for the year ahead.
Want More Great Investing Ideas?
ABNB shares were trading at $117.55 per share on Friday afternoon, up $2.03 (+1.76%). Year-to-date, ABNB has gained 37.49%, versus a 16.21% rise in the benchmark S&P 500 index during the same period.
About the Author: Anushka Dutta

Anushka is an analyst whose interest in understanding the impact of broader economic changes on financial markets motivated her to pursue a career in investment research. More...
More Resources for the Stocks in this Article
| Ticker | POWR Rating | Industry Rank | Rank in Industry |
| ABNB | Get Rating | Get Rating | Get Rating |
| GEBHY | Get Rating | Get Rating | Get Rating |
| GIGNY | Get Rating | Get Rating | Get Rating |
| IHG | Get Rating | Get Rating | Get Rating |


