
For the past four months, the price of Applied Material’s (AMAT - Get Rating) shares have been steadily rising and a trendline has formed on its chart.
AMAT is one of the world’s largest suppliers of semiconductor manufacturing equipment. The company has been the industry leader for over 20 years. Strong demand in semiconductor equipment should fuel growth for the foreseeable future.
Take a look at the 1-year chart of AMAT below with added notations. You’ll see I highlighted the trendline of support in blue:
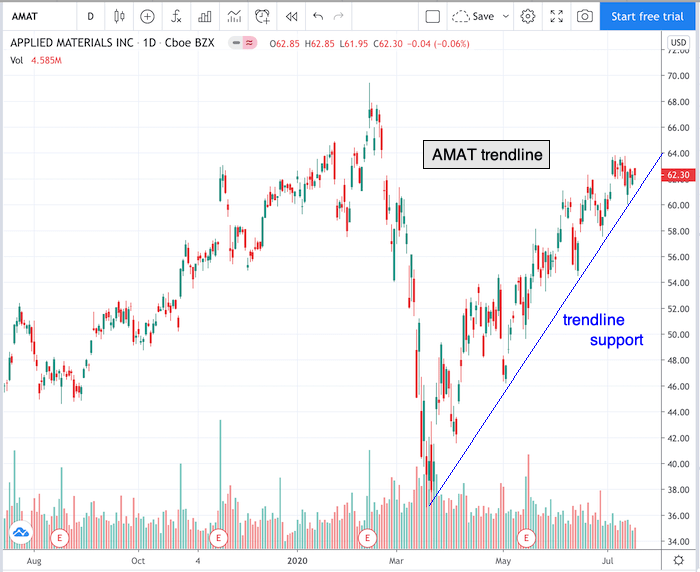
Chart of AMAT provided by TradingView
Any 2 points can start a trend line, but it’s the 3rd test and beyond that confirm its relevance. As you can see, AMAT has tested the trendline 7 times.
If AMAT were to trade below the trendline, a trader could initiate a short position with the expectation of a breakdown in the price of the stock.
AMAT will release its next earnings report on August 14th. So be mindful of that date as earnings reports often create volatility.
Have a good trading day!
Good luck!
Christian Tharp, CMT
@cmtstockcoach
Want More Great Investing Ideas?
9 “BUY THE DIP” Growth Stocks for 2020
Newly REVISED 2020 Stock Market Outlook
7 “Safe-Haven” Dividend Stocks for Turbulent Times
AMAT shares were trading at $62.13 per share on Monday morning, down $0.17 (-0.27%). Year-to-date, AMAT has gained 2.51%, versus a 0.81% rise in the benchmark S&P 500 index during the same period.
About the Author: christian

Christian is an expert stock market coach at the Adam Mesh Trading Group who has mentored more than 4,000 traders and investors. He is a professional technical analyst that is a certified Chartered Market Technician (CMT), which is a designation awarded by the CMT Association. Christian is also the author of the daily online newsletter Todays Big Stock. More...
More Resources for the Stocks in this Article
| Ticker | POWR Rating | Industry Rank | Rank in Industry |
| AMAT | Get Rating | Get Rating | Get Rating |