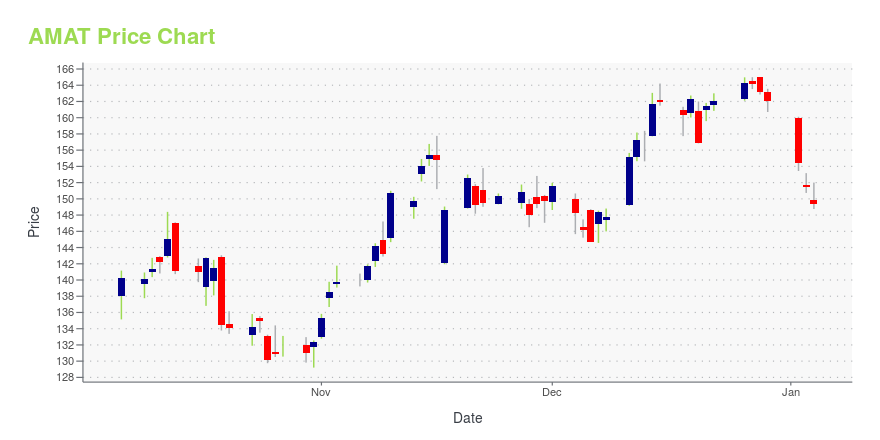
Applied Materials Inc. (AMAT): Price and Financial Metrics
GET POWR RATINGS... FREE!
AMAT POWR Grades
- AMAT scores best on the Momentum dimension, with a Momentum rank ahead of 90.37% of US stocks.
- AMAT's strongest trending metric is Stability; it's been moving up over the last 179 days.
- AMAT's current lowest rank is in the Value metric (where it is better than 47.47% of US stocks).
AMAT Stock Summary
- AMAT has a market capitalization of $124,947,337,740 -- more than approximately 98.04% of US stocks.
- Applied Materials Inc's stock had its IPO on January 1, 1986, making it an older stock than 92.84% of US equities in our set.
- Of note is the ratio of Applied Materials Inc's sales and general administrative expense to its total operating expenses; merely 14.86% of US stocks have a lower such ratio.
- If you're looking for stocks that are quantitatively similar to Applied Materials Inc, a group of peers worth examining would be AMD, MU, LRCX, REGN, and KLAC.
- Visit AMAT's SEC page to see the company's official filings. To visit the company's web site, go to www.appliedmaterials.com.
AMAT Valuation Summary
- AMAT's price/sales ratio is 5.6; this is 5.66% higher than that of the median Technology stock.
- Over the past 243 months, AMAT's price/sales ratio has gone up 1.9.
- Over the past 243 months, AMAT's EV/EBIT ratio has gone up 4.3.
Below are key valuation metrics over time for AMAT.
Stock | Date | P/S | P/B | P/E | EV/EBIT |
---|---|---|---|---|---|
AMAT | 2021-09-01 | 5.6 | 10.0 | 22.7 | 19.2 |
AMAT | 2021-08-31 | 5.6 | 10.1 | 23.0 | 19.4 |
AMAT | 2021-08-30 | 5.7 | 10.2 | 23.1 | 19.6 |
AMAT | 2021-08-27 | 5.7 | 10.2 | 23.2 | 19.6 |
AMAT | 2021-08-26 | 5.5 | 9.9 | 22.5 | 19.1 |
AMAT | 2021-08-25 | 6.1 | 10.1 | 27.4 | 22.7 |
AMAT Growth Metrics
- Its 5 year net cashflow from operations growth rate is now at 116.68%.
- Its 4 year price growth rate is now at 131.86%.
- Its 5 year revenue growth rate is now at 61.37%.

The table below shows AMAT's growth in key financial areas (numbers in millions of US dollars).
Date | Revenue | Operating Cash Flow | Net Income to Common Stock |
---|---|---|---|
2021-12-31 | 24,172 | 6,679 | 6,550 |
2021-09-30 | 23,063 | 5,442 | 5,888 |
2021-06-30 | 21,628 | 5,609 | 5,307 |
2021-03-31 | 19,827 | 4,790 | 4,432 |
2020-12-31 | 18,202 | 4,238 | 3,857 |
2020-09-30 | 17,202 | 3,804 | 3,619 |
AMAT's Quality Factors
The “Quality” component of the POWR Ratings focuses on 31 different factors of a companies fundamentals and operational strength. Here are some key insights as we drill into the specifics of these quality attributes.- AMAT has a Quality Grade of B, ranking ahead of 85.5% of graded US stocks.
- AMAT's asset turnover comes in at 0.918 -- ranking 55th of 208 Electronic Equipment stocks.
- BDR, MPWR, and ADI are the stocks whose asset turnover ratios are most correlated with AMAT.
The table below shows AMAT's key quality metrics over time.
Period | Asset Turnover | Gross Margin | ROIC |
---|---|---|---|
2021-08-01 | 0.918 | 0.467 | 0.425 |
2021-05-02 | 0.872 | 0.458 | 0.367 |
2021-01-31 | 0.821 | 0.450 | 0.319 |
2020-10-25 | 0.808 | 0.447 | 0.308 |
2020-07-26 | 0.796 | 0.442 | 0.285 |
2020-04-26 | 0.777 | 0.440 | 0.270 |
AMAT Price Target
For more insight on analysts targets of AMAT, see our AMAT price target page. And for a list of of all stocks sorted by upside potential based on analyst target price, see our Top Price Target page.
Average Price Target | $162.38 | Average Broker Recommendation | 1.53 (Moderate Buy) |
AMAT Stock Price Chart Interactive Chart >
AMAT Price/Volume Stats
Current price | $106.46 | 52-week high | $167.06 |
Prev. close | $110.74 | 52-week low | $101.33 |
Day low | $101.33 | Volume | 16,285,500 |
Day high | $112.74 | Avg. volume | 8,584,197 |
50-day MA | $119.78 | Dividend yield | 0.9% |
200-day MA | $135.40 | Market Cap | 94.05B |
Applied Materials Inc. (AMAT) Company Bio
Applied Materials, Inc. is an American corporation that supplies equipment, services and software for the manufacture of semiconductor (integrated circuit) chips for electronics, flat panel displays for computers, smartphones and televisions, and solar products. The company also supplies equipment to produce coatings for flexible electronics, packaging and other applications. The company is headquartered in Santa Clara, California, in Silicon Valley. (Source:Wikipedia)
Latest AMAT News From Around the Web
Below are the latest news stories about Applied Materials Inc that investors may wish to consider to help them evaluate AMAT as an investment opportunity.
Applied Materials: Buying This Tech Stock Is a No-BrainerThe stock has dropped despite a solid quarterly report, but the big picture points toward better times ahead. |
Russia’s Chip Supply at Risk From U.S.-Led Sanction Push(Bloomberg) -- The Biden administration and EU’s call for sanctions against Russia will jeopardize the country’s ability to buy semiconductors and other technology -- and it could affect military technologies in the future.Most Read from BloombergRussia Vetoes UN Resolution as China Abstains: Ukraine UpdateTaiwan to Join in U.S.-Led Sanctions on Russia: Ukraine UpdateU.S. Moves to Sanction Putin as Russian Forces Surround KyivRussia Invasion of Ukraine Ignites European Security CrisisChina State |
1 Monster Opportunity in the Global Chip ShortageSemiconductors have turned into a gigantic industry over the past few decades. Estimates have global spending at $553 billion in 2021, up from a measly $33 billion worldwide in 1987. Analysts expect the industry to continue growing to almost $1 trillion in total annual spending by 2030, as there is an increased demand for computing processes around the world with the growth of electronics, data centers, and artificial intelligence (AI) technology. |
7 Semiconductor Stocks to Buy as Deals Shake Up the IndustryAs semiconductor stocks continue to get hotter, these equities look very attractive with many among the best stocks period. |
Applied Materials Continues To Underperform Even The Smallest CompetitorsNo summary available. |
AMAT Price Returns
1-mo | -5.62% |
3-mo | N/A |
6-mo | -28.27% |
1-year | -16.67% |
3-year | 174.73% |
5-year | 151.82% |
YTD | -32.22% |
2021 | 83.64% |
2020 | 43.29% |
2019 | 89.86% |
2018 | -34.92% |
2017 | 59.86% |
AMAT Dividends
Ex-Dividend Date | Type | Payout Amount | Change | ||||||
---|---|---|---|---|---|---|---|---|---|
Loading, please wait... |
Continue Researching AMAT
Want to do more research on Applied Materials Inc's stock and its price? Try the links below:Applied Materials Inc (AMAT) Stock Price | Nasdaq
Applied Materials Inc (AMAT) Stock Quote, History and News - Yahoo Finance
Applied Materials Inc (AMAT) Stock Price and Basic Information | MarketWatch
Loading social stream, please wait...