

Shares of American Tower (AMT - Get Rating) have been climbing nicely and are just about 3% from an all-time high.
In March the stock hit 52-week lows and as it has rallied over the past 4 months a rising wedge pattern has emerged.
AMT owns and operates approximately 180,000 cell towers throughout North America, Asia, Europe, and the Middle East. The company is poised to benefit from growth in mobile data usage as wireless carriers continue the move towards 5G. This increases demand for AMT’s towers.
Take a look at the 1-year chart of AMT below with added notations:
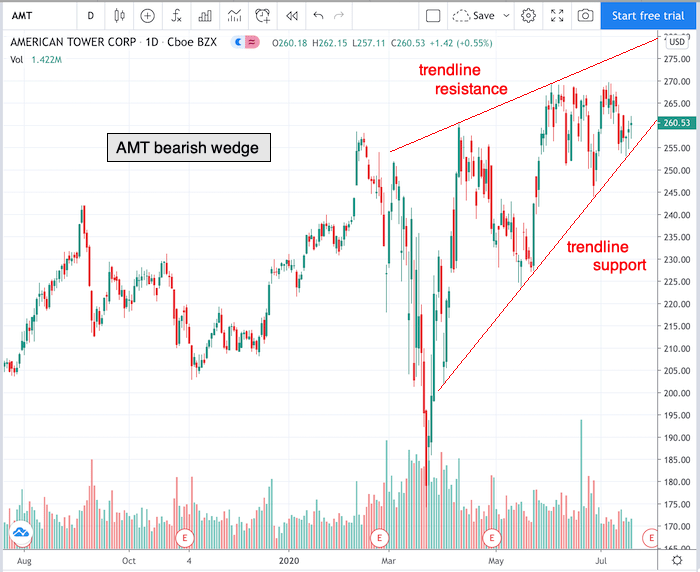
Chart of AMT provided by TradingView
AMT has formed a resistance trendline and a support trendline (red). These two lines are converging on one another to form a rising wedge pattern, which is viewed as a bearish pattern.
A short trade could be entered on a break below the wedge trendline support, which currently sits just under $260.
Keep an eye out for AMT’s next earnings release which is scheduled on July 30th.
Have a good trading day!
Good luck!
Christian Tharp, CMT
Want More Great Investing Ideas?
9 “BUY THE DIP” Growth Stocks for 2020
Newly REVISED 2020 Stock Market Outlook
7 “Safe-Haven” Dividend Stocks for Turbulent Times
AMT shares were trading at $260.32 per share on Tuesday morning, down $0.21 (-0.08%). Year-to-date, AMT has gained 14.22%, versus a 2.59% rise in the benchmark S&P 500 index during the same period.
About the Author: christian

Christian is an expert stock market coach at the Adam Mesh Trading Group who has mentored more than 4,000 traders and investors. He is a professional technical analyst that is a certified Chartered Market Technician (CMT), which is a designation awarded by the CMT Association. Christian is also the author of the daily online newsletter Todays Big Stock. More...
More Resources for the Stocks in this Article
| Ticker | POWR Rating | Industry Rank | Rank in Industry |
| AMT | Get Rating | Get Rating | Get Rating |


