NASDAQ stocks had their worst month since the Financial Crisis in 2008. The VIX, a measure of investor fear, is nearing the highest levels since the Covid Crisis began. Seemingly impervious Apple has felt the fury as well, even after a record-breaking revenue quarter.
Shares of Apple (AAPL) are now at oversold levels that have signaled major buy points in the past. I like to use a straightforward system to identify potential technical turning points. The process used was presented in a previous article for those who missed it.
The AAPL stock chart below shows times when 9-day RSI, MACD, and Bollinger Percent B reached oversold readings at the same time. AAPL was also trading at a big discount to the 20-day moving average as well. All these previous instances proved to mark significant short-term lows in AAPL stock as highlighted in aqua. Apple once again generated a technical buy based on these indicators just recently.
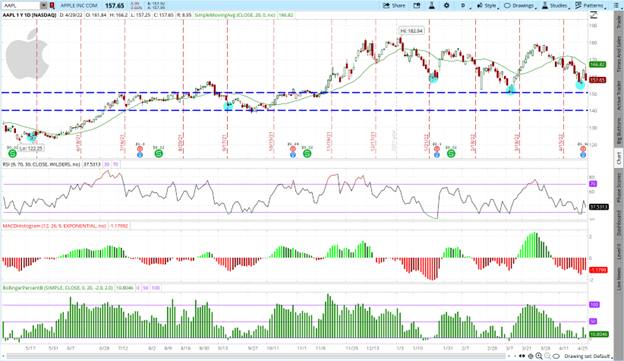
There is major horizontal support at the $150 level for Apple. $140 is additional downside support.
Implied volatility (IV) is signaling a buy as well. The recent red-hot rise has taken IV to extremes once again.
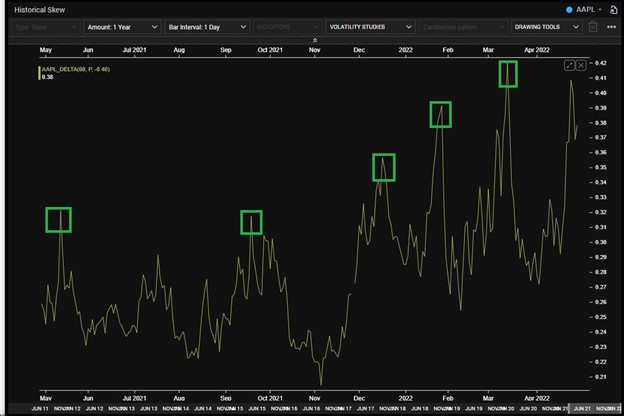
Important to notice how these major spikes in IV have coincided with the major buy points from the price chart earlier. Combining IV analysis along with technical analysis can make for a much more robust timing tool.
Implied volatility also means option prices are much more expensive. This makes selling strategies more effective when constructing trades.
Let’s walk through how selling puts now to be paid to be a buyer of Apple at lower levels has become a more profitable endeavor with lower risk.
All things being equal, the following two should hold true regarding put prices:
- Higher stock prices should equate to lower put prices
- Less time until expiration should mean lower put prices
All things are not equal in the case of implied volatility (IV) in AAPL options from last November until now. A quick side by side comparison while highlight how the recent spike in IV has made put prices dramatically more expensive.
Below is the option montage from 11/12/2021

Below is the similar option montage from last Friday – 4/29/2022

The current put prices are much more expensive even though AAPL stock was much lower back in November and there are two more days until expiration. This is because of the enormous jump in IV.

Let’s look at just how much using the table above. On November 12 AAPL stock was over 7 points lower than it closed on Friday ($149.99 versus $157.65). The December $150 puts back then had 49 days until expiration (DTE) compared to 47 for the June $150 puts on Friday.
So even though the stock was sharply lower and there was more time until expiration, the Dec $150 puts back in November were trading 55 cents cheaper than similar June $150 puts are now.
Why? Implied volatility (IV). IV has risen nearly 80% from November 12 until today. This 17.6 point increase means the price of the options has shot up towards the highest levels we have seen in the past 12 months. And this is even after earnings.
Selling puts obligates the seller to buy the stock at the strike price sold. In our example selling the June $150 puts would obligate the seller to be a buyer of AAPL stock at $150. For this obligation, the seller receives the option premium, or the price of the option. Selling an AAPL June $150 put for $5.40 would obligate the seller to buy 100 shares of AAPL stock at $150 while receiving $540 up front for that obligation. This effectively puts the net buy price (or breakeven) at $144.60 ($150 strike less $5.40 premium received.)
Compare that to the same scenario back on November 12. The put seller is still obligated at $150 but only receives $485 up front. This puts the breakeven buy price at $145.15.
The cushion, or difference between the current stock price and breakeven is dramatically bigger now than in November due to the huge pop in IV. The cushion now is just over 13 points compared to just under 5 back in November. 8.28% cushion now versus just 3.23% cushion then to put it in percentage terms. So, selling puts now means a bigger upfront payment along with much more downside protection versus just a few months ago. All because IV has exploded higher due to heightened fear in the market.
Warren Buffett is a big holder of Apple stock. It comprises nearly 50% of the Berkshire Hathaway portfolio. Warren Buffett also has an adage that says “Be Greedy When Others Are Fearful”. So be like Warren and take advantage of the fear with a bullish short put position in a beaten down APPL stock.
POWR Options
What To Do Next?
If you’re looking for the best options trades for today’s market, you should check out our latest presentation How to Trade Options with the POWR Ratings. Here we show you how to consistently find the top options trades, while minimizing risk.
If that appeals to you, and you want to learn more about this powerful new options strategy, then click below to get access to this timely investment presentation now:
How to Trade Options with the POWR Ratings
All the Best!
Tim Biggam
Editor, POWR Options Newsletter
Want More Great Investing Ideas?
shares closed at $412.00 on Friday, down $-15.81 (-3.70%). Year-to-date, has declined -12.99%, versus a % rise in the benchmark S&P 500 index during the same period.
About the Author: Tim Biggam

Tim spent 13 years as Chief Options Strategist at Man Securities in Chicago, 4 years as Lead Options Strategist at ThinkorSwim and 3 years as a Market Maker for First Options in Chicago. He makes regular appearances on Bloomberg TV and is a weekly contributor to the TD Ameritrade Network "Morning Trade Live". His overriding passion is to make the complex world of options more understandable and therefore more useful to the everyday trader. Tim is the editor of the POWR Options newsletter. Learn more about Tim's background, along with links to his most recent articles. More...


