

Benjamin Graham, the Godfather of Value Investing, summed up the notion of technical versus fundamentals with his quote:
“In the short run the market is a voting machine. In the long run it is a weighing machine.”
The multi-year melt up in stocks is starting to soften. Continued out-sized annual returns will be more difficult to come by. This is especially true now that the Fed has begun to withdraw liquidity and raise interest rates.
Staying nimble and picking the right stocks at the right time will carry ever more importance in the coming months. The POWR Ratings will definitely help you pick the right stocks. Technical analysis will help you pick the right time to both enter and exit positions.
A quick walk through of the recent trades in ArcelorMittal (MT) for the POWR Options portfolio will help to show how I use technical analysis to identify price areas to consider putting on and taking off positions.
My approach is just one of many. It is, however, a simple methodology that has stood the test of time. So let’s jump in.
The chart below is a one-year price chart for MT stock. There is horizontal support at the $28 area. I like to term it “eyeball support.” MT has bounced off this level seven times in the past 12 months. Clearly a solid support area:

Once an area of interest is identified, just a little more work needs to be done. My method utilizes only four main components:
- 9-day RSI (Relative Strength Index)
- MACD (Moving Average Convergence Divergence) Histogram
- Bollinger Percent B
- 20-day moving average
RSI indicates when a stock is getting overbought (above 70) or oversold (under 30). MACD compares the 12-day moving average to a longer 26-day moving average to help uncover divergences in momentum.
Bollinger Percent B is a volatility-based indicator that identifies where the closing price of a stock is relative to the upper and lower bands. 100 is the upper band and 0 is the lower band.
The 20-day moving average is widely followed, especially by the algo machines that dominate trading today.
When all four indicators align at the same time, it is usually a reliable indication that things have gotten overdone either to the upside or downside. Time to take a counter-trend position.
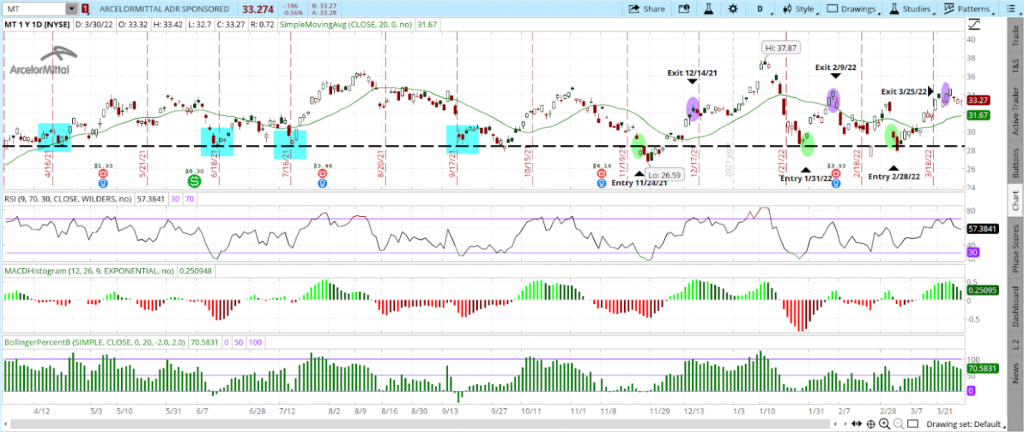
Looking at the chart again shows the three times POWR Options took a long position in MT calls based on oversold readings (light green).
9-day RSI was under 30, MACD was deeply in the red, Bollinger Percent B was nearing zero and shares were trading at a big discount to the 20-day moving average.
The chart also shows how POWR Options used the same method to exit those positions based on overbought readings (purple).
The method is simple. Buy when things get oversold and sell when things get overbought. To quote Warren Buffett, “Be Greedy When Others Are Fearful and Be Fearful When Others Are Greedy.”
The results of the three trades are shown below:
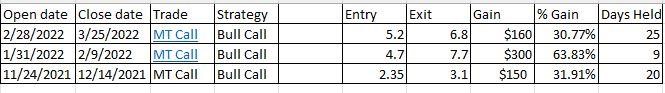
Certainly not all results will be this effective. Trading is about probability, not certainty. Using a simple technical methodology along with the POWR ratings can help provide a solid one-two-punch to put the odds in your favor when swing trading options.
What To Do Next?
While the concepts behind options trading are simpler than most people realize, applying those concepts to consistently make winning options trades is no easy task.
The solution is to let me do the hard work for you, by starting a 30 day to my POWR Options newsletter.
I’ve been uncovering the best options trades for over 30 years and with the quantitative muscle of the POWR Ratings as my starting point I’ve achieved an 87% win rate over my last 15 closed trades!
During your trial you’ll get full access to the current portfolio, weekly market commentary and every trade alert by text & email.
I’ll be adding the next 2 exciting options trades (1 call and 1 put) when the market opens this Monday morning, so start your trial today so you don’t miss out.
There’s no obligation beyond the 30 day trial, so there is absolutely no risk in getting started today.
About POWR Options & 30 Day Trial >>
Here’s to good trading!
Tim Biggam
Editor, POWR Options Newsletter
Want More Great Investing Ideas?
SPY shares rose $0.01 (0.00%) in after-hours trading Friday. Year-to-date, SPY has declined -4.34%, versus a % rise in the benchmark S&P 500 index during the same period.
About the Author: Tim Biggam

Tim spent 13 years as Chief Options Strategist at Man Securities in Chicago, 4 years as Lead Options Strategist at ThinkorSwim and 3 years as a Market Maker for First Options in Chicago. He makes regular appearances on Bloomberg TV and is a weekly contributor to the TD Ameritrade Network "Morning Trade Live". His overriding passion is to make the complex world of options more understandable and therefore more useful to the everyday trader. Tim is the editor of the POWR Options newsletter. Learn more about Tim's background, along with links to his most recent articles. More...
More Resources for the Stocks in this Article
| Ticker | POWR Rating | Industry Rank | Rank in Industry |
| SPY | Get Rating | Get Rating | Get Rating |
| .INX | Get Rating | Get Rating | Get Rating |
| DIA | Get Rating | Get Rating | Get Rating |
| IWM | Get Rating | Get Rating | Get Rating |
| QQQ | Get Rating | Get Rating | Get Rating |


