

A rectangle pattern developed in Ciena Corp (CIEN - Get Rating). The resistance level was broken yesterday but I am still looking to possibly make a trade.
CIEN is a network strategy and technology company. It provides network hardware, software, and services that support the transport, aggregation, service delivery and management of video, data, and voice traffic on communications networks. The company is well-suited to benefit from the modernization of networks by telecom carriers to meet increasing needs.
Take a look at the 1-year chart of CIEN below with added notations:
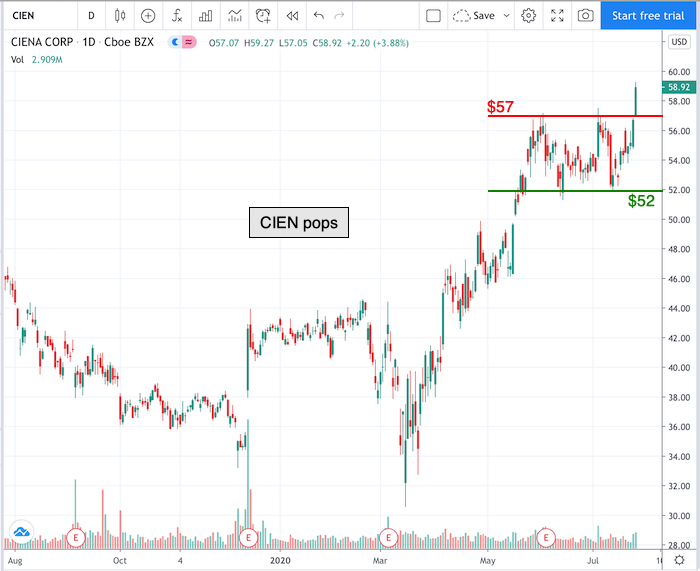
Chart of CIEN provided by TradingView
CIEN had been in a trading range for several weeks. During that period of time, the stock formed a resistance level at $57 (red) and a level of support at $52 (green). At some point the stock had to break one of the two levels created by the rectangle pattern, and yesterday the stock broke the resistance level.
One basic tenet of technical analysis is that broken resistance turns into potential support and visa versa. After a break above resistance (or below support), there is sometimes a return to test this newfound support level (or resistance level). A return to or near the original breakout level can offer a second chance to enter a trade.
Therefore, the ideal opportunity for a trader at this point would be to buy CIEN on a pullback at or near that $57 level, with the assumption that it will now be a support level.
Have a good trading day!
Good luck!
Christian Tharp, CMT
@cmtstockcoach
Want More Great Investing Ideas?
9 “BUY THE DIP” Growth Stocks for 2020
Newly REVISED 2020 Stock Market Outlook
7 “Safe-Haven” Dividend Stocks for Turbulent Times
CIEN shares rose $0.28 (+0.48%) in premarket trading Tuesday. Year-to-date, CIEN has gained 39.19%, versus a 1.17% rise in the benchmark S&P 500 index during the same period.
About the Author: christian

Christian is an expert stock market coach at the Adam Mesh Trading Group who has mentored more than 4,000 traders and investors. He is a professional technical analyst that is a certified Chartered Market Technician (CMT), which is a designation awarded by the CMT Association. Christian is also the author of the daily online newsletter Todays Big Stock. More...
More Resources for the Stocks in this Article
| Ticker | POWR Rating | Industry Rank | Rank in Industry |
| CIEN | Get Rating | Get Rating | Get Rating |


