Chart Industries Inc. (GTLS - Get Rating) manufactures and sells engineered equipment for the energy and industrial gas industries worldwide. The company is known to traders as a way to invest in the increased demand for natural gas.
The company also manufactures equipment in the medical industry. GTLS supplies liquid oxygen storage equipment that is used to store liquid oxygen for ventilators and we know those are in very high demand due to COVID-19.
Analysts expect 5.5% revenue growth next year and EPS current year growth of 56.3%
The Tale of the Tape:
Take a look at the 1-year chart of Chart of GTLS below with my added notations:
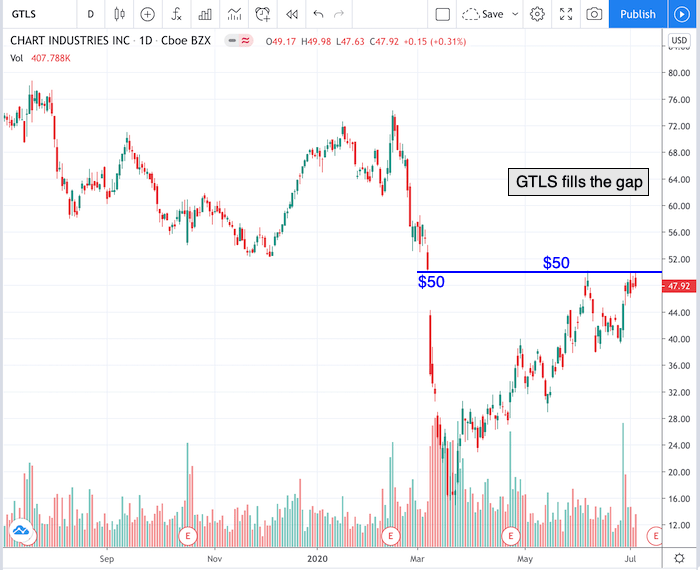
Chart of GTLS provided by TradingView
GTLS has formed a key level of resistance at $50 over the past couple weeks. The stock has tested that $50 resistance level multiple times since the beginning of June. That level is also the top of the March gap.
A resistance level is a price point that a security, such as a stock, has trouble exceeding over a specific period of time. If the resistance level is broken, a trader could enter a long position above the level in anticipation of continued upward momentum in the stock price.
Before making any trading decision, traders should take other factors into account, such as the direction of the overall market, as well as the trajectory of the stock’s sector and industry.
If you decide to enter a trade we recommend using protective stops to mitigate losses if the trade winds up not being a winner. Capital preservation is always key!
Good luck!
Christian Tharp, CMT
@cmtstockcoach
Stock Trading & Investing for Everyone
Want More Great Investing Ideas?
9 “BUY THE DIP” Growth Stocks for 2020
Is the Bull S#*t Rally FINALLY Over?
7 “Safe-Haven” Dividend Stocks for Turbulent Times
Top 3 Investing Strategies for 2020
GTLS shares were trading at $47.32 per share on Tuesday morning, down $0.60 (-1.25%). Year-to-date, GTLS has declined -29.89%, versus a -0.75% rise in the benchmark S&P 500 index during the same period.
About the Author: christian

Christian is an expert stock market coach at the Adam Mesh Trading Group who has mentored more than 4,000 traders and investors. He is a professional technical analyst that is a certified Chartered Market Technician (CMT), which is a designation awarded by the CMT Association. Christian is also the author of the daily online newsletter Todays Big Stock. More...
More Resources for the Stocks in this Article
| Ticker | POWR Rating | Industry Rank | Rank in Industry |
| GTLS | Get Rating | Get Rating | Get Rating |