Chart Industries, Inc. (GTLS): Price and Financial Metrics
GTLS Stock Summary
- The price/operating cash flow metric for Chart Industries Inc is higher than 82.47% of stocks in our set with a positive cash flow.
- With a year-over-year growth in debt of -41.93%, Chart Industries Inc's debt growth rate surpasses only 8.79% of about US stocks.
- In terms of twelve month growth in earnings before interest and taxes, Chart Industries Inc is reporting a growth rate of 338.48%; that's higher than 95.12% of US stocks.
- Stocks that are quantitatively similar to GTLS, based on their financial statements, market capitalization, and price volatility, are WOR, MCRI, FLXS, AMED, and NVEE.
- GTLS's SEC filings can be seen here. And to visit Chart Industries Inc's official web site, go to www.chartindustries.com.
GTLS Stock Price Chart Interactive Chart >
GTLS Price/Volume Stats
Current price | $145.70 | 52-week high | $166.14 |
Prev. close | $143.94 | 52-week low | $27.11 |
Day low | $142.60 | Volume | 204,600 |
Day high | $146.89 | Avg. volume | 354,361 |
50-day MA | $145.65 | Dividend yield | N/A |
200-day MA | $102.73 | Market Cap | 5.29B |
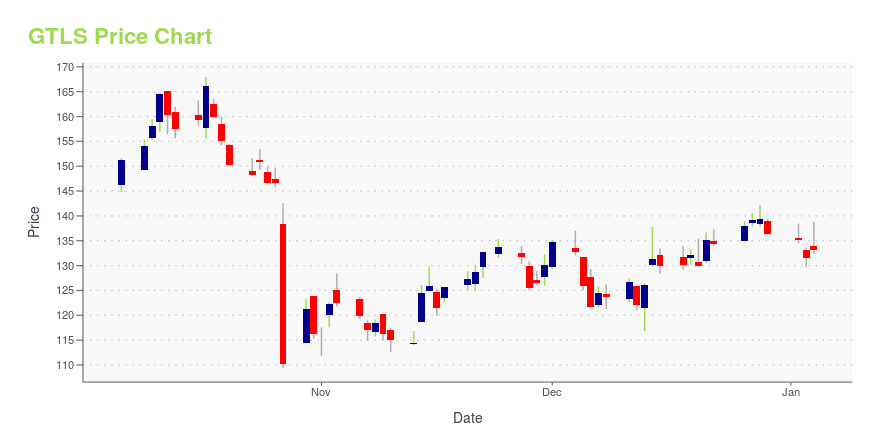
Chart Industries, Inc. (GTLS) Company Bio
Chart Industries manufactures and sells engineered equipment for the industrial gas, energy, and biomedical industries worldwide. The company operates in three segments: Energy & Chemicals (E&C), Distribution & Storage (D&S), and BioMedical. The company in 1992 and is based in Garfield Heights, Ohio.
GTLS Price Forecast Based on DCF Valuation
Current Price | DCF Fair Value Target: | Forecasted Gain: |
$145.70 | $224.65 | 56% |
The table below illustrates the output of a discounted cash flow forecast using a variety of scenarios for Chart Industries Inc. To summarize, we found that Chart Industries Inc ranked in the 65th percentile in terms of potential gain offered. Specifically, our DCF analysis implies the stock is trading below its fair value by an estimated 57%. As for the metrics that stood out in our discounted cash flow analysis of Chart Industries Inc, consider:
- GTLS's estimated cost of debt, based largely on its market capitalization and its interest coverage ratio, is 3%; for context, that number is higher than 36.41% of tickers in our DCF set.
- Chart Industries Inc's interest coverage rate -- a measure of gross earnings relative to interest payments -- comes in at 19.25. This coverage rate is greater than that of 83.86% of stocks we're observing for the purpose of forecasting via discounted cash flows.
- Relative to other stocks in its sector (Industrials), Chart Industries Inc has a reliance on debt greater than only 21.78% of them.
Terminal Growth Rate in Free Cash Flow | Return Relative to Current Share Price |
0% | 53% |
1% | 55% |
2% | 56% |
3% | 58% |
4% | 59% |
5% | 61% |
TIKK, GOL, ROAD, BV, and CVEO can be thought of as valuation peers to GTLS, in the sense that they are in the Industrials sector and have a similar price forecast based on DCF valuation.
Latest GTLS News From Around the Web
Below are the latest news stories about Chart Industries Inc that investors may wish to consider to help them evaluate GTLS as an investment opportunity.
Plug Power Stock Is a Buy Again Following Its Recent WeaknessWall Street is greatly underestimating the longer-term outlook of hydrogen and Plug Power, while PLUG stock appears to have stabilized. |
Chart Industries (GTLS) Earnings Expected to Grow: What to Know Ahead of Next Week's ReleaseChart Industries (GTLS) doesn't possess the right combination of the two key ingredients for a likely earnings beat in its upcoming report. Get prepared with the key expectations. |
Chart Industries Releases Sustainability Report and ESG MetricsATLANTA, April 07, 2021 (GLOBE NEWSWIRE) -- Chart Industries Inc. (“Chart”) (NSYE: GTLS), a leading global manufacturer of liquefaction and cryogenic equipment serving multiple applications in the clean energy and industrial gas end markets today released its 2020 ESG Performance Report, which is contained as a supplement to this release. As part of the report, we highlight our carbon reduction efforts, diversity and inclusion initiatives and safety records as well as detailing examples of how we help our customers achieve their own sustainability goals. Chart is proud to be at the forefront of the clean energy transition as a leading provider of technology, equipment and services related to liquefied natural gas, hydrogen, biogas, carbon capture and water treatment, amongst other appli... |
Reliance, other energy majors form hydrogen coalitionLed by domestic energy giant Reliance Industries, many global energy and industrial players on Tuesday came together to form a new energy transition coalition, called the India H2 Alliance (IH2A), to help commercialise hydrogen technologies in their bid to build net-zero carbon energy pathways in the country. The alliance will work together to build the hydrogen economy and supply chain and also help develop blue and green hydrogen production and storage apart from building hydrogen-use industrial clusters and transport use-cases with hydrogen-powered fuel cells, a statement from the alliance said. However, the statement did not name other founding members in the coalition. The alliance will focus on industrial clusters, specifically steel, refineries, fertilisers, cement, ports and log... |
Energy transition coalition ‘India H2 Alliance’ formed by industry majorsGlobal players commit to collaborate on building a hydrogen economy and supply chain in India Chart Industries and Reliance Industries to act as steering group co-leads Industry players to help develop hydrogen production and storage, industrial and transport use-cases NEW DELHI, India and MUMBAI, India, April 06, 2021 (GLOBE NEWSWIRE) -- Global energy and industrial majors have come together to form a new energy transition coalition, the India H2 Alliance (“IH2A”), focussed on commercializing hydrogen technologies and systems to build net-zero carbon pathways in India. The India H2 Alliance will work together to build the hydrogen economy and supply chain in India and help develop blue and green hydrogen production and storage as well as build hydrogen-use industrial clusters and trans... |
GTLS Price Returns
1-mo | 1.26% |
3-mo | 8.02% |
6-mo | 75.33% |
1-year | 361.08% |
3-year | 140.91% |
5-year | 493.24% |
YTD | 23.69% |
2020 | 74.53% |
2019 | 3.78% |
2018 | 38.78% |
2017 | 30.09% |
2016 | 100.56% |
Continue Researching GTLS
Here are a few links from around the web to help you further your research on Chart Industries Inc's stock as an investment opportunity:Chart Industries Inc (GTLS) Stock Price | Nasdaq
Chart Industries Inc (GTLS) Stock Quote, History and News - Yahoo Finance
Chart Industries Inc (GTLS) Stock Price and Basic Information | MarketWatch
Get Free Updates
Join thousands of investors who get the latest news, insights and top rated picks from StockNews.com!
Loading social stream, please wait...