Chart Industries, Inc. (GTLS): Price and Financial Metrics

Chart Industries, Inc. (GTLS): $164.72

0.59 (-0.36%)

POWR Rating

Component Grades

Momentum

B

Stability

F

Sentiment

Quality

D

Add GTLS to Watchlist
Sign Up

Industry: Industrial - Equipment

Industry

C

Ranked

#71 of 87

in industry

GTLS Price/Volume Stats

Current price $164.72 52-week high $184.65
Prev. close $165.31 52-week low $105.89
Day low $163.71 Volume 540,250
Day high $168.61 Avg. volume 646,848
50-day MA $134.94 Dividend yield N/A
200-day MA $146.30 Market Cap 6.96B

GTLS Stock Price Chart Interactive Chart >

GTLS POWR Grades

  • GTLS scores best on the Growth dimension, with a Growth rank ahead of 98.76% of US stocks.
  • The strongest trend for GTLS is in Value, which has been heading up over the past 26 weeks.
  • GTLS ranks lowest in Quality; there it ranks in the 2nd percentile.

GTLS Stock Summary

  • Price to trailing twelve month operating cash flow for GTLS is currently 83.48, higher than 96.55% of US stocks with positive operating cash flow.
  • With a year-over-year growth in debt of 382.24%, CHART INDUSTRIES INC's debt growth rate surpasses 97.52% of about US stocks.
  • Revenue growth over the past 12 months for CHART INDUSTRIES INC comes in at 79.71%, a number that bests 94.46% of the US stocks we're tracking.
  • Stocks with similar financial metrics, market capitalization, and price volatility to CHART INDUSTRIES INC are AUVI, ADES, BMRC, LCNB, and FRPT.
  • GTLS's SEC filings can be seen here. And to visit CHART INDUSTRIES INC's official web site, go to www.chartindustries.com.

GTLS Valuation Summary

  • GTLS's price/sales ratio is 2.1; this is 0% higher than that of the median Industrials stock.
  • GTLS's price/sales ratio has moved up 1.2 over the prior 212 months.

Below are key valuation metrics over time for GTLS.

Stock Date P/S P/B P/E EV/EBIT
GTLS 2023-12-29 2.1 2.2 -89.9 57.3
GTLS 2023-12-28 2.1 2.3 -92.0 58.0
GTLS 2023-12-27 2.1 2.3 -91.8 58.0
GTLS 2023-12-26 2.1 2.2 -91.0 57.7
GTLS 2023-12-22 2.1 2.2 -88.6 56.8
GTLS 2023-12-21 2.1 2.2 -89.2 57.0

GTLS Growth Metrics

    The 2 year net income to common stockholders growth rate now stands at -19.07%.
  • Its 3 year net income to common stockholders growth rate is now at -47.41%.
  • The 5 year net cashflow from operations growth rate now stands at 43.91%.
Over the past 70 months, GTLS's revenue has gone up $742,908,000.

The table below shows GTLS's growth in key financial areas (numbers in millions of US dollars).

Date Revenue Operating Cash Flow Net Income to Common Stock
2022-12-31 1,612.4 80.8 22.6
2022-09-30 1,549.9 70.6 76.5
2022-06-30 1,466.1 19.5 50.2
2022-03-31 1,383.3 -51.8 43.7
2021-12-31 1,317.7 -21.3 59.1
2021-09-30 1,251.2 36.9 304.8

GTLS's Quality Factors

The “Quality” component of the POWR Ratings focuses on 31 different factors of a companies fundamentals and operational strength. Here are some key insights as we drill into the specifics of these quality attributes.
  • GTLS has a Quality Grade of D, ranking ahead of 5.95% of graded US stocks.
  • GTLS's asset turnover comes in at 0.454 -- ranking 7th of 7 Fabricated Products stocks.
  • PKOH, TRS, and MTRN are the stocks whose asset turnover ratios are most correlated with GTLS.

The table below shows GTLS's key quality metrics over time.

Period Asset Turnover Gross Margin ROIC
2021-09-30 0.454 0.264 0.271
2021-06-30 0.455 0.279 0.285
2021-03-31 0.468 0.289 0.297
2020-12-31 0.476 0.282 0.265
2020-09-30 0.509 0.279 0.070
2020-06-30 0.541 0.278 0.068

GTLS Price Target

For more insight on analysts targets of GTLS, see our GTLS price target page. And for a list of of all stocks sorted by upside potential based on analyst target price, see our Top Price Target page.

Average Price Target $129.72 Average Broker Recommendation 1.44 (Moderate Buy)

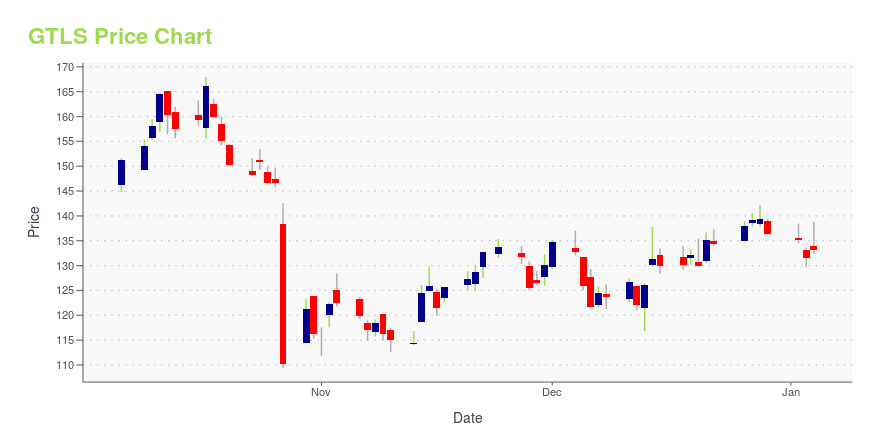
Chart Industries, Inc. (GTLS) Company Bio


Chart Industries manufactures and sells engineered equipment for the industrial gas, energy, and biomedical industries worldwide. The company operates in three segments: Energy & Chemicals (E&C), Distribution & Storage (D&S), and BioMedical. The company in 1992 and is based in Garfield Heights, Ohio.


GTLS Latest News Stream


Event/Time News Detail
Loading, please wait...

GTLS Latest Social Stream


Loading social stream, please wait...

View Full GTLS Social Stream

Latest GTLS News From Around the Web

Below are the latest news stories about CHART INDUSTRIES INC that investors may wish to consider to help them evaluate GTLS as an investment opportunity.

Chart Industries Announces LNG Awards

ATLANTA, Dec. 28, 2023 (GLOBE NEWSWIRE) -- Chart Industries, Inc. (NYSE: GTLS), a leading global engineering design firm and manufacturer of highly engineered equipment servicing multiple applications in clean energy and industrial gas markets announces the recent receipt of multiple LNG-related awards, including: IPSMR® liquefaction technology for two modular trains of a multi-train international Big LNG project (this project is not related to the international Big LNG IPSMR® project that was r

Yahoo | December 28, 2023

Hydrogen Hotties: 3 Stocks Poised for Explosive Growth in 2024

Hydrogen stocks could offer some of the most explosive opportunities on the new year.

Ian Cooper on InvestorPlace | December 26, 2023

Chart Industries to Present at Goldman Sachs Energy, CleanTech & Utilities Conference

ATLANTA, Dec. 22, 2023 (GLOBE NEWSWIRE) -- Chart Industries, Inc. (NYSE: GTLS), a leading global engineering design firm and manufacturer of highly engineered equipment servicing multiple applications in clean energy and industrial gas markets, will present at the Goldman Sachs Energy, CleanTech & Utilities Conference. President and Chief Executive Officer, Jill Evanko, will participate in a fireside discussion on Thursday, January 4th, at 11:00 am Eastern Time. A live webcast will be available

Yahoo | December 22, 2023

Investors Still Waiting For A Pull Back In Chart Industries, Inc. (NYSE:GTLS)

When close to half the companies in the Machinery industry in the United States have price-to-sales ratios (or "P/S...

Yahoo | December 18, 2023

Insider Buying: Director Linda Harty Acquires Shares of Chart Industries Inc (GTLS)

Insider buying can often provide valuable insights into a company's prospects and the confidence that insiders have in the business's future performance.

Yahoo | December 16, 2023

Read More 'GTLS' Stories Here

GTLS Price Returns

1-mo 25.27%
3-mo 20.82%
6-mo -2.60%
1-year 37.30%
3-year 24.60%
5-year 81.97%
YTD 20.82%
2023 18.31%
2022 -27.75%
2021 35.40%
2020 74.53%
2019 3.78%

Continue Researching GTLS

Here are a few links from around the web to help you further your research on Chart Industries Inc's stock as an investment opportunity:

Chart Industries Inc (GTLS) Stock Price | Nasdaq
Chart Industries Inc (GTLS) Stock Quote, History and News - Yahoo Finance
Chart Industries Inc (GTLS) Stock Price and Basic Information | MarketWatch

Get Free Updates

Join thousands of investors who get the latest news, insights and top rated picks from StockNews.com!