Chart of the Day: CarMax (KMX)

NYSE: KMX | CarMax Inc. News, Ratings, and Charts

KMX – Can CarMax (KMX) break $100 again.

During the past nine months, CarMax (KMX) has formed a key level of resistance, which could lead to a breakout very soon.

CarMax (KMX - Get Rating) sells, finances, and services used and new cars through a chain of over 220 retail stores. As the company continues to improve the customer shopping experience and enhance its online shopping capabilities, revenue growth should follow. KMX’s temporary cost cutting initiatives should also provide relief in the near term. 

Take a look at the 1-year chart of KMX below with added notations:

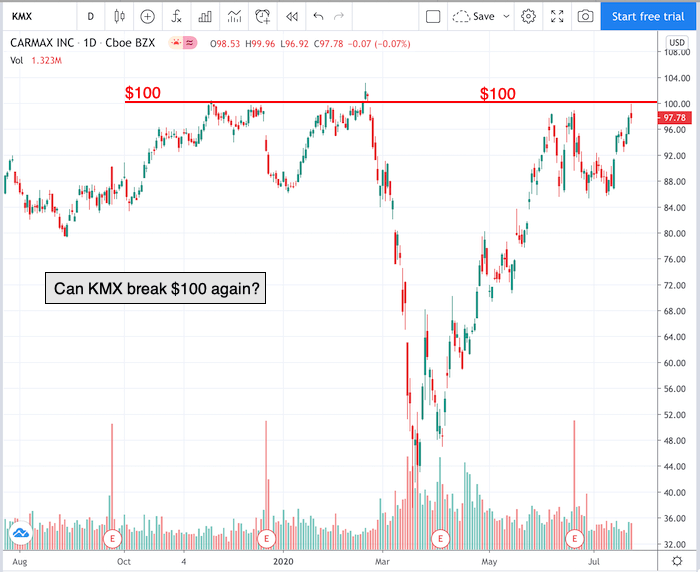
Chart of KMX provided by TradingView 

KMX has formed a key level of resistance to watch at the $100 (red) mark. The stock has tested that $100 level multiple times since the end of last year. Another close above that $100 level should lead to a breakout. 

Have a good trading day!

Good luck!

Christian Tharp, CMT

@cmtstockcoach

Want More Great Investing Ideas?

5 WINNING Stock Charts  

9 “BUY THE DIP” Growth Stocks for 2020

Newly REVISED 2020 Stock Market Outlook

7 “Safe-Haven” Dividend Stocks for Turbulent Times


KMX shares were trading at $97.17 per share on Friday morning, down $0.61 (-0.62%). Year-to-date, KMX has gained 10.84%, versus a 0.69% rise in the benchmark S&P 500 index during the same period.


About the Author: christian


Christian is an expert stock market coach at the Adam Mesh Trading Group who has mentored more than 4,000 traders and investors. He is a professional technical analyst that is a certified Chartered Market Technician (CMT), which is a designation awarded by the CMT Association. Christian is also the author of the daily online newsletter Todays Big Stock. More...


More Resources for the Stocks in this Article

TickerPOWR RatingIndustry RankRank in Industry
KMXGet RatingGet RatingGet Rating

Most Popular Stories on StockNews.com


Bear Market Watch: Week 2

Why does Steve Reitmeister believe the S&P 500 (SPY) needs to be back above 5,747 by 3/31 or it spells trouble for investors? Read on below for the full answer...

Has the Next Bear Market Already Arrived?

The recent break below the 200 day moving average for the S&P 500 (SPY) has a lot of investors worried that the next bear market has already arrived. Investment expert Steve Reitmeister shares his timely views along with a trading plan to stay on the right side of the action.

How Low Will Stocks Go?

The S&P 500 (SPY) is testing the 200 day moving average with fears on tariffs and GDP that could push them even lower. Now is a good time to hear what 40 year investment veteran Steve Reitmeister says about the market outlook and odds of bear market.

Why is Stock Market Outlook So Uncertain?

The S&P 500 (SPY) has quickly pushed back from the highs and once again on the verge of a break below the 100 day moving average. Why is this happening? And what comes next? 40 year investment veteran Steve Reitmeister shares his view and top stocks in the commentary that follows...

Trump or the Fed More Important to Stock Investors?

The S&P 500 (SPY) is flirting with new highs once again. But it is not very clear what is driving these stock price gains. That is why Steve Reitmeister shares his latest views including a market outlook, trading plan and top picks to stay on the right side of the action.

Read More Stories

More CarMax Inc. (KMX) News View All

Event/Date Symbol News Detail Start Price End Price Change POWR Rating
Loading, please wait...
View All KMX News