CarMax Inc. (KMX): Price and Financial Metrics
GET POWR RATINGS... FREE!
KMX POWR Grades
- Growth is the dimension where KMX ranks best; there it ranks ahead of 55.72% of US stocks.
- The strongest trend for KMX is in Stability, which has been heading down over the past 179 days.
- KMX ranks lowest in Quality; there it ranks in the 11th percentile.
KMX Stock Summary
- Carmax Inc's capital turnover -- a measure of revenue relative to shareholder's equity -- is better than 93.65% of US listed stocks.
- Of note is the ratio of Carmax Inc's sales and general administrative expense to its total operating expenses; 99.41% of US stocks have a lower such ratio.
- For KMX, its debt to operating expenses ratio is greater than that reported by 92.37% of US equities we're observing.
- If you're looking for stocks that are quantitatively similar to Carmax Inc, a group of peers worth examining would be MATX, MIDD, XP, MGPI, and BR.
- Visit KMX's SEC page to see the company's official filings. To visit the company's web site, go to www.carmax.com.
KMX Valuation Summary
- KMX's price/sales ratio is 0.9; this is 35.71% lower than that of the median Consumer Cyclical stock.
- Over the past 243 months, KMX's price/earnings ratio has gone down 14.8.
Below are key valuation metrics over time for KMX.
Stock | Date | P/S | P/B | P/E | EV/EBIT |
---|---|---|---|---|---|
KMX | 2021-08-27 | 0.9 | 4.4 | 17.5 | 22.6 |
KMX | 2021-08-26 | 0.9 | 4.4 | 17.5 | 22.6 |
KMX | 2021-08-25 | 0.9 | 4.4 | 17.6 | 22.7 |
KMX | 2021-08-24 | 0.9 | 4.3 | 17.4 | 22.5 |
KMX | 2021-08-23 | 0.9 | 4.3 | 17.3 | 22.4 |
KMX | 2021-08-20 | 0.9 | 4.3 | 17.2 | 22.4 |
KMX Growth Metrics
- Its 3 year net cashflow from operations growth rate is now at 209.46%.
- Its year over year cash and equivalents growth rate is now at 127.31%.
- Its 2 year cash and equivalents growth rate is now at 30.74%.

The table below shows KMX's growth in key financial areas (numbers in millions of US dollars).
Date | Revenue | Operating Cash Flow | Net Income to Common Stock |
---|---|---|---|
2021-12-31 | 29,377.97 | -2,283.271 | 1,201.406 |
2021-09-30 | 26,035.16 | -1,607.337 | 1,167.268 |
2021-06-30 | 23,418.97 | -693.682 | 1,178.697 |
2021-03-31 | 18,950.15 | 667.76 | 746.919 |
2020-12-31 | 18,748.38 | 749.686 | 751.908 |
2020-09-30 | 18,353.47 | 778.626 | 689.764 |
KMX's Quality Factors
The “Quality” component of the POWR Ratings focuses on 31 different factors of a companies fundamentals and operational strength. Here are some key insights as we drill into the specifics of these quality attributes.- KMX has a Quality Grade of D, ranking ahead of 9.16% of graded US stocks.
- KMX's asset turnover comes in at 1.16 -- ranking 120th of 165 Retail stocks.
- GPI, LE, and BOOT are the stocks whose asset turnover ratios are most correlated with KMX.
The table below shows KMX's key quality metrics over time.
Period | Asset Turnover | Gross Margin | ROIC |
---|---|---|---|
2021-08-31 | 1.160 | 0.116 | 0.043 |
2021-05-31 | 1.082 | 0.126 | 0.046 |
2021-02-28 | 0.906 | 0.126 | 0.030 |
2020-11-30 | 0.901 | 0.129 | 0.031 |
2020-08-31 | 0.887 | 0.130 | 0.029 |
2020-05-31 | 0.890 | 0.128 | 0.026 |
KMX Price Target
For more insight on analysts targets of KMX, see our KMX price target page. And for a list of of all stocks sorted by upside potential based on analyst target price, see our Top Price Target page.
Average Price Target | $149.00 | Average Broker Recommendation | 1.47 (Moderate Buy) |
KMX Stock Price Chart Interactive Chart >
KMX Price/Volume Stats
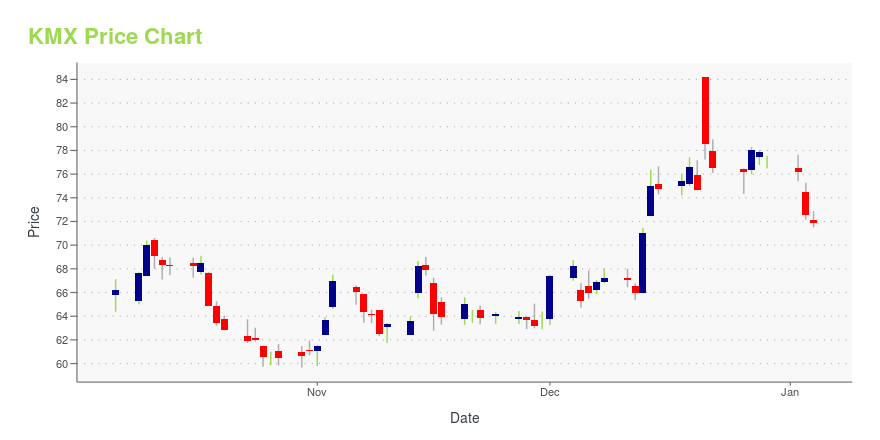
Current price | $99.17 | 52-week high | $155.98 |
Prev. close | $99.47 | 52-week low | $84.37 |
Day low | $98.32 | Volume | 710,800 |
Day high | $100.70 | Avg. volume | 1,699,927 |
50-day MA | $94.89 | Dividend yield | N/A |
200-day MA | $110.63 | Market Cap | 15.78B |
CarMax Inc. (KMX) Company Bio
CarMax is a used vehicle retailer based in the United States. It operates two business segments: CarMax Sales Operations and CarMax Auto Finance. The corporate entity behind the formation of CarMax was Circuit City Stores, Inc. The first CarMax retail location opened in September 1993 in Richmond, Virginia. As of May 2021, CarMax operates 225 locations. (Source:Wikipedia)
Latest KMX News From Around the Web
Below are the latest news stories about Carmax Inc that investors may wish to consider to help them evaluate KMX as an investment opportunity.
CarMax (KMX) Stock Moves -0.81%: What You Should KnowCarMax (KMX) closed the most recent trading day at $100.35, moving -0.81% from the previous trading session. |
I Ran A Stock Scan For Earnings Growth And CarMax (NYSE:KMX) Passed With EaseFor beginners, it can seem like a good idea (and an exciting prospect) to buy a company that tells a good story to... |
Carvana Stock Will Likely Keep Falling as the Bears Take ControlCarvana may double its revenue this year, but it's paying more for cars and there are other troubling signs. |
CarMax Inc – Consensus Indicates Potential 26.9% UpsideCarMax Inc with ticker code (KMX) now have 13 analysts covering the stock with the consensus suggesting a rating of ''Buy''. The target price ranges between 195 and 87 calculating the average target price we see 143.77. With the stocks previous close at 113.32 this is indicating there is a potential upside of 26.9%. The 50 day MA is 121.93 and the 200 day moving average is 129.48. The company has a market capitalisation of $17,717m. Company Website: https://www.carmax.com [stock_market_widget type="chart" symbol="KMX" chart="bar" range="6mo" interval="1d" line-color="rgb(49, 125, 189)"] The potential market cap would be $22,478m based on the market concensus. CarMax, through its subsidiaries, operates as a retailer of used vehicles in the United States. The company operates in two segme... |
CarMax (KMX) Stock Moves -1.92%: What You Should KnowCarMax (KMX) closed the most recent trading day at $107.48, moving -1.92% from the previous trading session. |
KMX Price Returns
1-mo | 7.03% |
3-mo | 7.54% |
6-mo | -12.00% |
1-year | -26.00% |
3-year | 18.02% |
5-year | 52.03% |
YTD | -23.85% |
2021 | 37.87% |
2020 | 7.74% |
2019 | 39.76% |
2018 | -2.18% |
2017 | -0.40% |
Continue Researching KMX
Here are a few links from around the web to help you further your research on Carmax Inc's stock as an investment opportunity:Carmax Inc (KMX) Stock Price | Nasdaq
Carmax Inc (KMX) Stock Quote, History and News - Yahoo Finance
Carmax Inc (KMX) Stock Price and Basic Information | MarketWatch
Loading social stream, please wait...