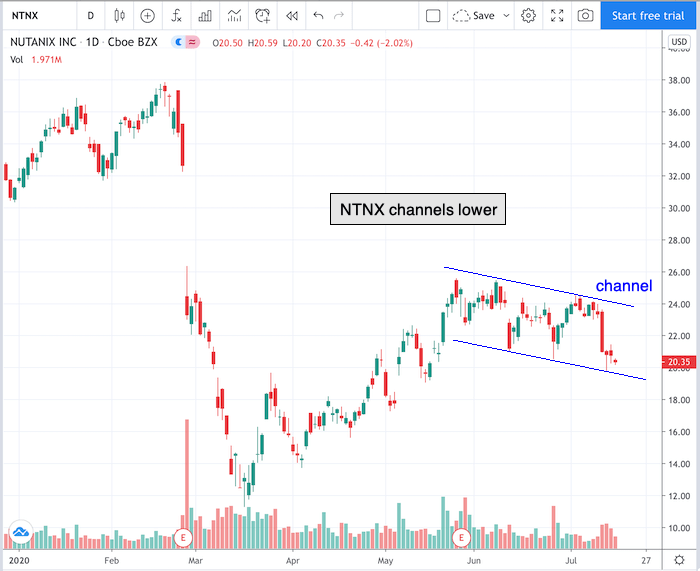
While many stocks are near rallying, some are noticeable laggards. Take for instance Nutanix Inc. (NTNX). Shares of the company are more than 40% lower than its 52-week high.
NTNX provides native hybrid cloud capabilities for businesses. The company generates most of its revenues through license fees and support services.
A descending channel has formed in the chart of NTNX. A channel is formed through the combination of a trendline support that runs parallel to a trendline resistance.
Take a look at the 1-year chart of NTNX below with added notations:

Chart of NTNX provided by TradingView
When it comes to channels, remember that any 3 points can start the channel, but a 4th point or more confirms it. You can see that NTNX has tested its channel trendlines multiple times.
There are 2 possible trades I’m looking at in NTNX. The first is a breakout to the upside above the trendline resistance or a breakdown below the trendline support.
Have a good trading day!
Good luck!
Christian Tharp, CMT
@cmtstockcoach
Stock Trading & Investing for Everyone
Want More Great Investing Ideas?
9 “BUY THE DIP” Growth Stocks for 2020
Newly REVISED 2020 Stock Market Outlook
7 “Safe-Haven” Dividend Stocks for Turbulent Times
NTNX shares were trading at $21.78 per share on Friday morning, up $1.43 (+7.03%). Year-to-date, NTNX has declined -30.33%, versus a 0.48% rise in the benchmark S&P 500 index during the same period.
About the Author: christian

Christian is an expert stock market coach at the Adam Mesh Trading Group who has mentored more than 4,000 traders and investors. He is a professional technical analyst that is a certified Chartered Market Technician (CMT), which is a designation awarded by the CMT Association. Christian is also the author of the daily online newsletter Todays Big Stock. More...
More Resources for the Stocks in this Article
| Ticker | POWR Rating | Industry Rank | Rank in Industry |
| NTNX | Get Rating | Get Rating | Get Rating |


