Nutanix, Inc. - (NTNX): Price and Financial Metrics

Nutanix, Inc. - (NTNX): $61.93

1.79 (-2.81%)

POWR Rating

Component Grades

Momentum

C

Stability

C

Sentiment

Quality

B

Add NTNX to Watchlist
Sign Up

Industry: Software - Application

Industry

B

Ranked

#23 of 131

in industry

NTNX Price/Volume Stats

Current price $61.93 52-week high $66.99
Prev. close $63.72 52-week low $23.34
Day low $61.04 Volume 2,216,400
Day high $64.69 Avg. volume 2,900,867
50-day MA $59.62 Dividend yield N/A
200-day MA $41.90 Market Cap 15.13B

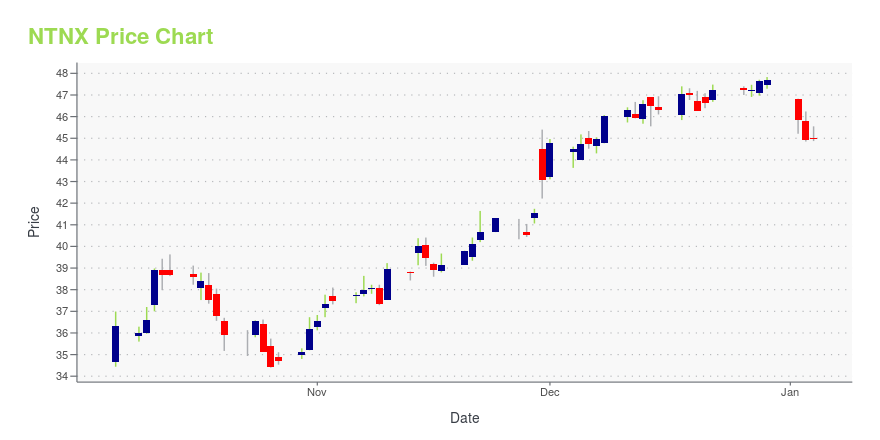
NTNX Stock Price Chart Interactive Chart >

NTNX POWR Grades

  • NTNX scores best on the Growth dimension, with a Growth rank ahead of 97.54% of US stocks.
  • The strongest trend for NTNX is in Value, which has been heading down over the past 26 weeks.
  • NTNX's current lowest rank is in the Stability metric (where it is better than 45.39% of US stocks).

NTNX Stock Summary

  • The capital turnover (annual revenue relative to shareholder's equity) for NTNX is -3.02 -- better than just 3.82% of US stocks.
  • Price to trailing twelve month operating cash flow for NTNX is currently 30.92, higher than 86.82% of US stocks with positive operating cash flow.
  • Equity multiplier, or assets relative to shareholders' equity, comes in at -3.38 for NUTANIX INC; that's greater than it is for only 4.29% of US stocks.
  • Stocks that are quantitatively similar to NTNX, based on their financial statements, market capitalization, and price volatility, are NCNO, RAMP, PCOR, INTA, and ZG.
  • NTNX's SEC filings can be seen here. And to visit NUTANIX INC's official web site, go to www.nutanix.com.

NTNX Valuation Summary

  • NTNX's price/sales ratio is 5.8; this is 114.81% higher than that of the median Technology stock.
  • NTNX's price/earnings ratio has moved down 35.4 over the prior 88 months.

Below are key valuation metrics over time for NTNX.

Stock Date P/S P/B P/E EV/EBIT
NTNX 2023-12-08 5.8 -17.4 -65.4 -79.1
NTNX 2023-12-07 5.6 -17.0 -63.9 -77.4
NTNX 2023-12-06 5.8 -15.2 -42.1 -49.3
NTNX 2023-12-05 5.8 -15.2 -42.1 -49.3
NTNX 2023-12-04 5.7 -15.1 -41.9 -49.1
NTNX 2023-12-01 5.8 -15.2 -42.2 -49.4

NTNX's Quality Factors

The “Quality” component of the POWR Ratings focuses on 31 different factors of a companies fundamentals and operational strength. Here are some key insights as we drill into the specifics of these quality attributes.
  • NTNX has a Quality Grade of C, ranking ahead of 55.21% of graded US stocks.
  • NTNX's asset turnover comes in at 0.608 -- ranking 267th of 563 Business Services stocks.
  • MIME, FIVN, and RPD are the stocks whose asset turnover ratios are most correlated with NTNX.

The table below shows NTNX's key quality metrics over time.

Period Asset Turnover Gross Margin ROIC
2021-07-31 0.608 0.791 -0.498
2021-04-30 0.615 0.789 -0.466
2021-01-31 0.639 0.787 -0.605
2020-10-31 0.676 0.784 -0.640
2020-07-31 0.719 0.781 -0.690
2020-04-30 0.702 0.774 -0.709

NTNX Price Target

For more insight on analysts targets of NTNX, see our NTNX price target page. And for a list of of all stocks sorted by upside potential based on analyst target price, see our Top Price Target page.

Average Price Target $47.21 Average Broker Recommendation 1.6 (Moderate Buy)

Nutanix, Inc. - (NTNX) Company Bio


Nutanix, Inc., together with its subsidiaries, provides enterprise cloud platform solutions that converge traditional silos of server, virtualization, and storage into one integrated solution. The company was founded in 2009 and is based in San Jose, California.


NTNX Latest News Stream


Event/Time News Detail
Loading, please wait...

NTNX Latest Social Stream


Loading social stream, please wait...

View Full NTNX Social Stream

Latest NTNX News From Around the Web

Below are the latest news stories about NUTANIX INC that investors may wish to consider to help them evaluate NTNX as an investment opportunity.

Here’s Why Nutanix (NTNX) Executed Well in Q3

Chartwell Investment Partners, LLC, an affiliate of Carillon Tower Advisers, Inc., released the “Carillon Chartwell Small Cap Value Fund” third quarter 2023 investor letter. A copy of the same can be downloaded here. Information technology and industrials were the top-performing sectors in the Carillon Chartwell Small Cap Growth Fund, with alpha production coming from well-chosen stocks. […]

Yahoo | December 27, 2023

What Makes Nutanix (NTNX) a New Buy Stock

Nutanix (NTNX) might move higher on growing optimism about its earnings prospects, which is reflected by its upgrade to a Zacks Rank #2 (Buy).

Yahoo | December 22, 2023

Nutanix Stock Earns Another Composite Rating Upgrade During Move Up

Nutanix Cl A saw its IBD SmartSelect Composite Rating rise to 96 Tuesday, up from 94 the day before.

Yahoo | December 19, 2023

Insider Sell Alert: Nutanix Inc's CEO Rajiv Ramaswami Offloads 24,439 Shares

In a notable insider transaction, President and CEO Rajiv Ramaswami sold 24,439 shares of Nutanix Inc (NASDAQ:NTNX) on December 18, 2023.

Yahoo | December 19, 2023

Insider Sell Alert: Nutanix Inc's CEO Rajiv Ramaswami Offloads 87,174 Shares

In a notable insider transaction, President and CEO Rajiv Ramaswami of Nutanix Inc (NASDAQ:NTNX) sold a substantial number of shares in the company.

Yahoo | December 13, 2023

Read More 'NTNX' Stories Here

NTNX Price Returns

1-mo 6.35%
3-mo 29.86%
6-mo 77.55%
1-year 145.07%
3-year 138.10%
5-year 64.10%
YTD 29.86%
2023 83.07%
2022 -18.24%
2021 -0.03%
2020 1.95%
2019 -24.84%

Continue Researching NTNX

Here are a few links from around the web to help you further your research on Nutanix Inc's stock as an investment opportunity:

Nutanix Inc (NTNX) Stock Price | Nasdaq
Nutanix Inc (NTNX) Stock Quote, History and News - Yahoo Finance
Nutanix Inc (NTNX) Stock Price and Basic Information | MarketWatch

Get Free Updates

Join thousands of investors who get the latest news, insights and top rated picks from StockNews.com!