

I highlighted last week some reasons why I thought stocks, and particularly QQQ, had finally formed a significant top in my latest commentary for POWR Options. One of the biggest reasons why the NASDAQ looks tired and toppy was complacency-which was reflected in the form of option prices.
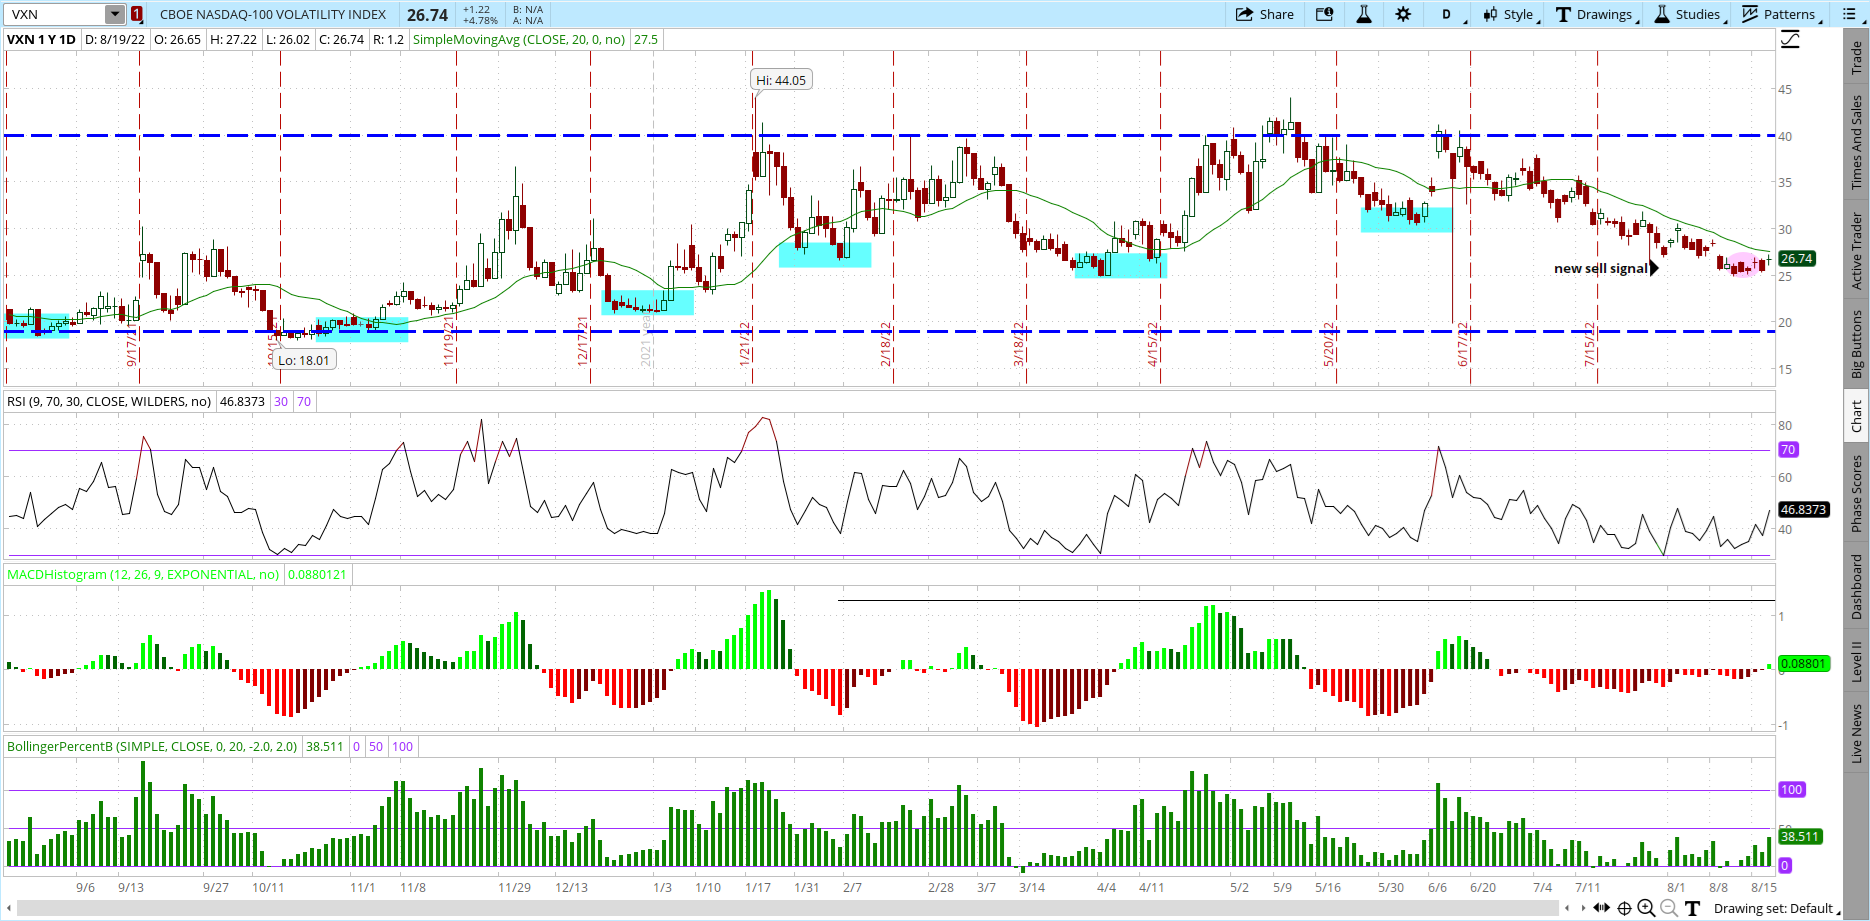
Most of you are probably very familiar with the VIX-sometimes called the “Fear Index”. The VIX is a general measure of 30-day option prices on the S&P 500. It tends to spike when stock prices fall sharply and usually falls when stock prices rise.
VXN, or Vixen, is a similar measure of 30-day option prices using the NASDAQ 100 (QQQ) instead of the S&P 500 (SPY). Let’s take a look at how using the VXN as a market timing tool can help call significant short-term tops in the market. It is the equivalent of the Warren Buffett adage that says to “Be Fearful When Others Are Greedy.”
VXN sell signals are generated when VXN makes at least a 33% pullback from the previous high and then makes a reversal off the lows. Over the past 12 months there have been 6 such sell signals generated (highlighted in aqua on the chart below)
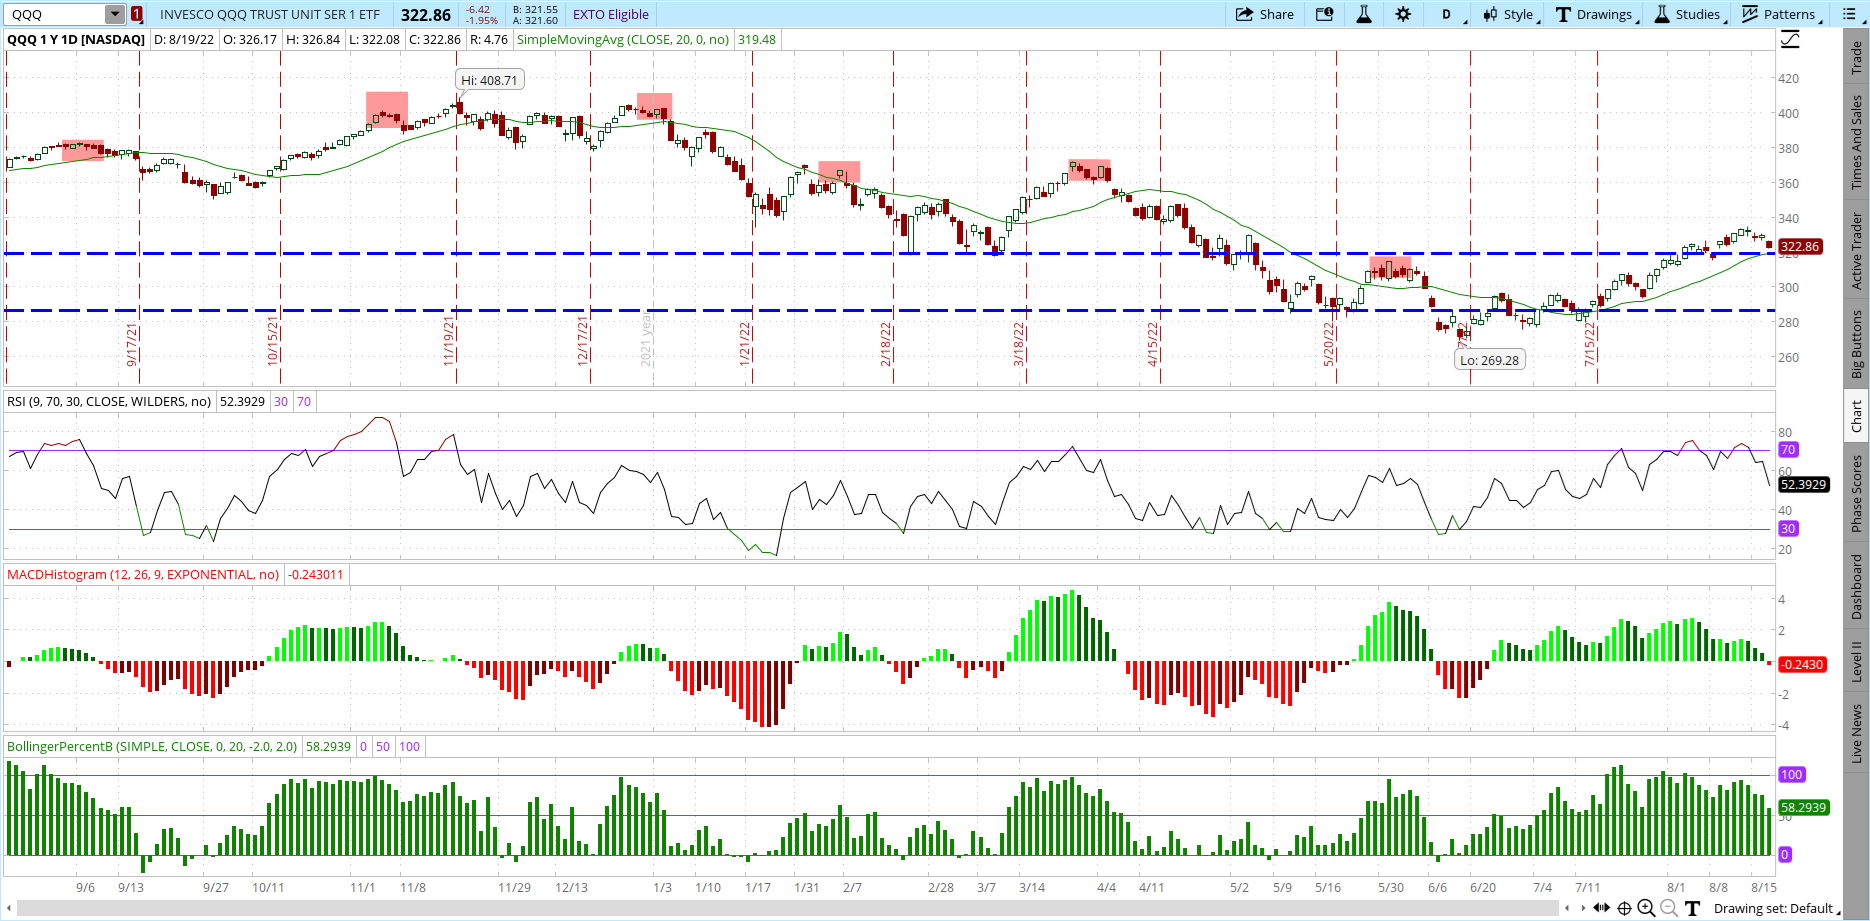
Below is the same time period 1 year chart of the QQQ. Note how the bottoms in VXN correspond precisely with the tops in QQQ (highlighted in red) .
I put together a quick snapshot summary of the VXN based sell signal methodology over the past year shown in the table below.
| Price of sell | Subsequent low | Gain | % gain | Date of low | Days to low | |
| 8/31/2021 | 379.95 | 352.62 | 27.33 | 7.19% | 10/4/2021 | 34 |
| 11/5/2021 | 398.6 | 380.69 | 17.91 | 4.49% | 12/20/2021 | 45 |
| 1/4/2022 | 396.47 | 341.4 | 55.07 | 13.89% | 1/27/2022 | 23 |
| 2/10/2022 | 358.43 | 318.17 | 40.26 | 11.23% | 3/14/2022 | 32 |
| 4/5/2022 | 361.1 | 291.15 | 69.95 | 19.37% | 5/12/2022 | 37 |
| 6/8/2022 | 307.4 | 271.39 | 36.01 | 11.71% | 6/16/2022 | 8 |
| 11.32% | 29.83 |
The average pullback over the past six sell signals has been just over 11%. It has taken about a month (29.83 days on average) for stocks to find a subsequent bottom after the sell signal was generated.
Just as importantly, the sell signals never really were too early or wrong in calling a short-term top. None of the prior six signals would have caused any subsequent angst by using the VXN methodology as a market timing tool. Indeed, only one of the signals had a minor unrealized loss after taking a short position in the QQQ. The other five were pretty much spot on in calling the top.
Using the VXN methodology means the market will tell you when it is time to act. This can be important as many time fundamental analysis and technical analysis can be way too early…which in this market environment makes it difficult to hang on to a losing position for too long.
That’s not to say that fundamentals and other factors aren’t important as confirming indicators to take a bearish stance.
Both valuations and seasonality are also pointing to the probabilities favoring a pullback.
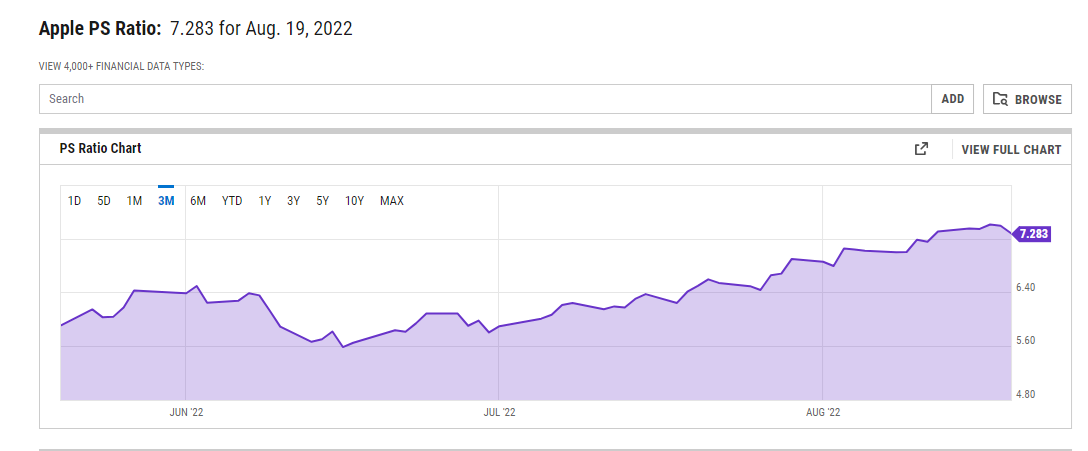
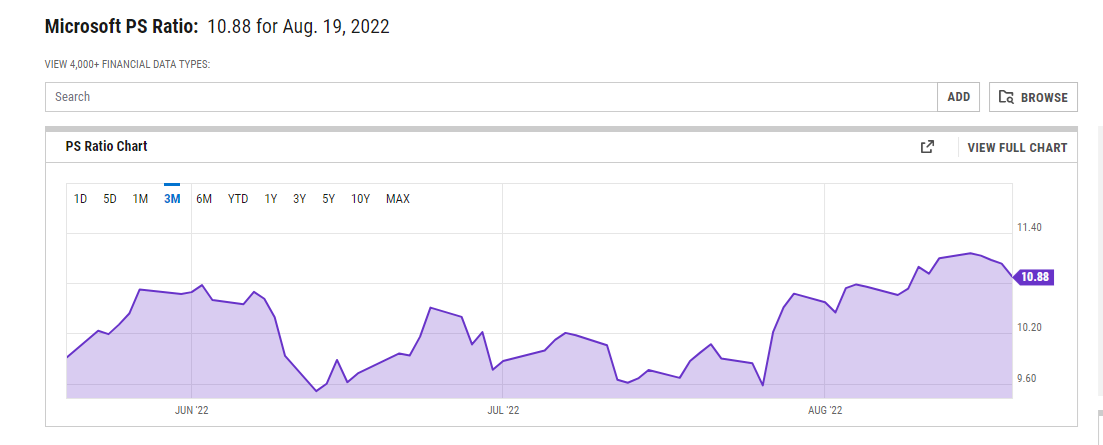
The two biggest market cap stocks in the NASDAQ 100 (QQQ) are Apple (AAPL) and Microsoft (MSFT). Both reached the highest multiples on a Price/Sales basis over the past three months before softening. Plus having 2 trillion-dollar plus market cap companies trading at such lofty valuations seems extreme unto itself. Further upside seems limited at best.
Seasonality supports the bearish argument as well.
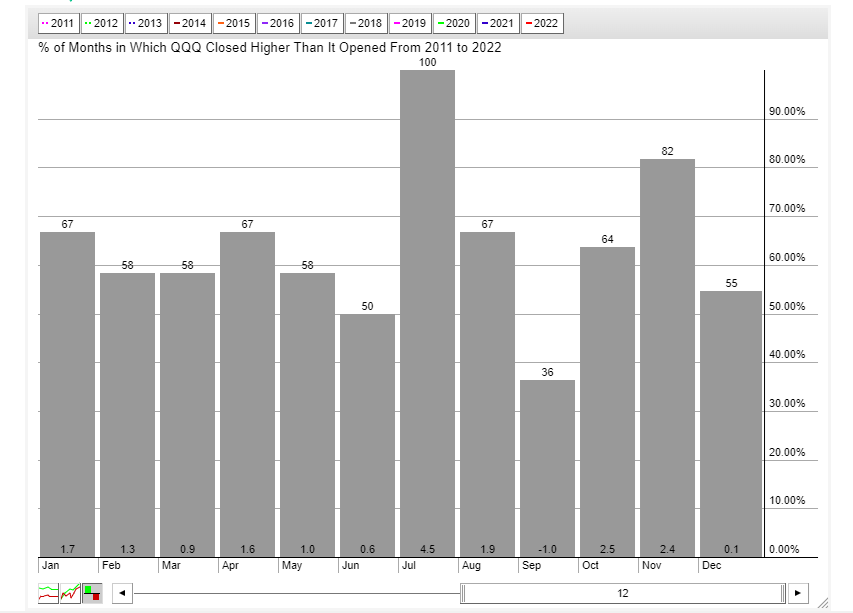
Over the past twelve years September has been the only down month for QQQ. Shares have shown gains less than half the time with an average loss of 1%. Every other month is positive on both performance and number of up months versus down months.
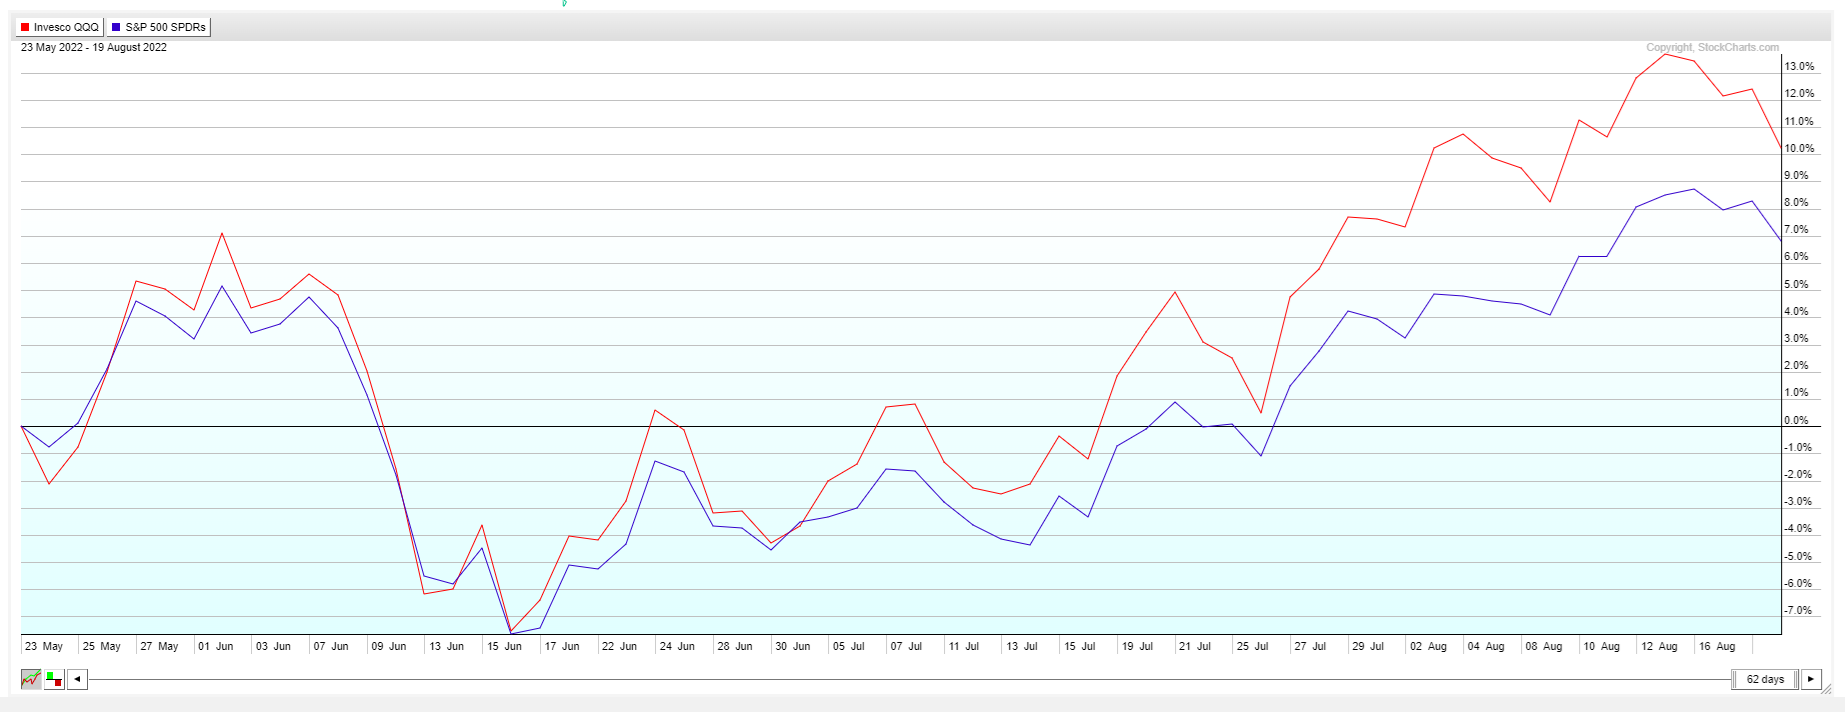
Comparative performance is also favoring a bigger pullback for QQQ versus SPY. Normally QQQ and SPY tend to be highly correlated. Over the past few months, however, QQQ has out-performed SPY to a large degree. Look for this correlation to revert back to the mean with QQQ beginning to under-perform to close that gap.
Comparative lows in the VXN also means option prices on the QQQ are comparatively cheap. This favors buying puts to take a defined risk short position. Exactly the type of strategy we use week-in and week-out in the POWR Options Portfolio.
So, traders looking to take a short position for the short-term would be best served buying puts versus shorting QQQ outright. Limited risk with potentially explosive returns. Plus an increase in implied volatility generally will be a benefit to the long put position as well.
POWR Options
What To Do Next?
If you’re looking for the best options trades for today’s market, you should check out our latest presentation How to Trade Options with the POWR Ratings. Here we show you how to consistently find the top options trades, while minimizing risk.
If that appeals to you, and you want to learn more about this powerful new options strategy, then click below to get access to this timely investment presentation now:
How to Trade Options with the POWR Ratings
All the Best!
Tim Biggam
Editor, POWR Options Newsletter
Want More Great Investing Ideas?
QQQ shares closed at $322.86 on Friday, down $-6.42 (-1.95%). Year-to-date, QQQ has declined -18.59%, versus a -10.46% rise in the benchmark S&P 500 index during the same period.
About the Author: Tim Biggam
Tim spent 13 years as Chief Options Strategist at Man Securities in Chicago, 4 years as Lead Options Strategist at ThinkorSwim and 3 years as a Market Maker for First Options in Chicago. He makes regular appearances on Bloomberg TV and is a weekly contributor to the TD Ameritrade Network "Morning Trade Live". His overriding passion is to make the complex world of options more understandable and therefore more useful to the everyday trader. Tim is the editor of the POWR Options newsletter. Learn more about Tim's background, along with links to his most recent articles. More...
More Resources for the Stocks in this Article
| Ticker | POWR Rating | Industry Rank | Rank in Industry |
| QQQ | Get Rating | Get Rating | Get Rating |
| AAPL | Get Rating | Get Rating | Get Rating |
| MSFT | Get Rating | Get Rating | Get Rating |
| Get Rating | Get Rating | Get Rating |


