

The VIX finally closed below 30 on Friday and below the 20-day moving average of 31.20. It is also nearing the critical 27.50 area that served as serious upside resistance for most of September until it finally gave way. Earnings from tech bell weathers Apple (AAPL) and Microsoft (MSFT) next week and the Fed rate decision the following week will likely tell the tale regarding direction of both stocks and the VIX into year-end.
I had written an article in late August on how option prices can help predict future stock prices. I specifically used the VXN -or VIX of the NASDAQ stocks- to show how the big pullback in VXN equated to a short-term top in NASDAQ stocks (QQQ), as shown below.
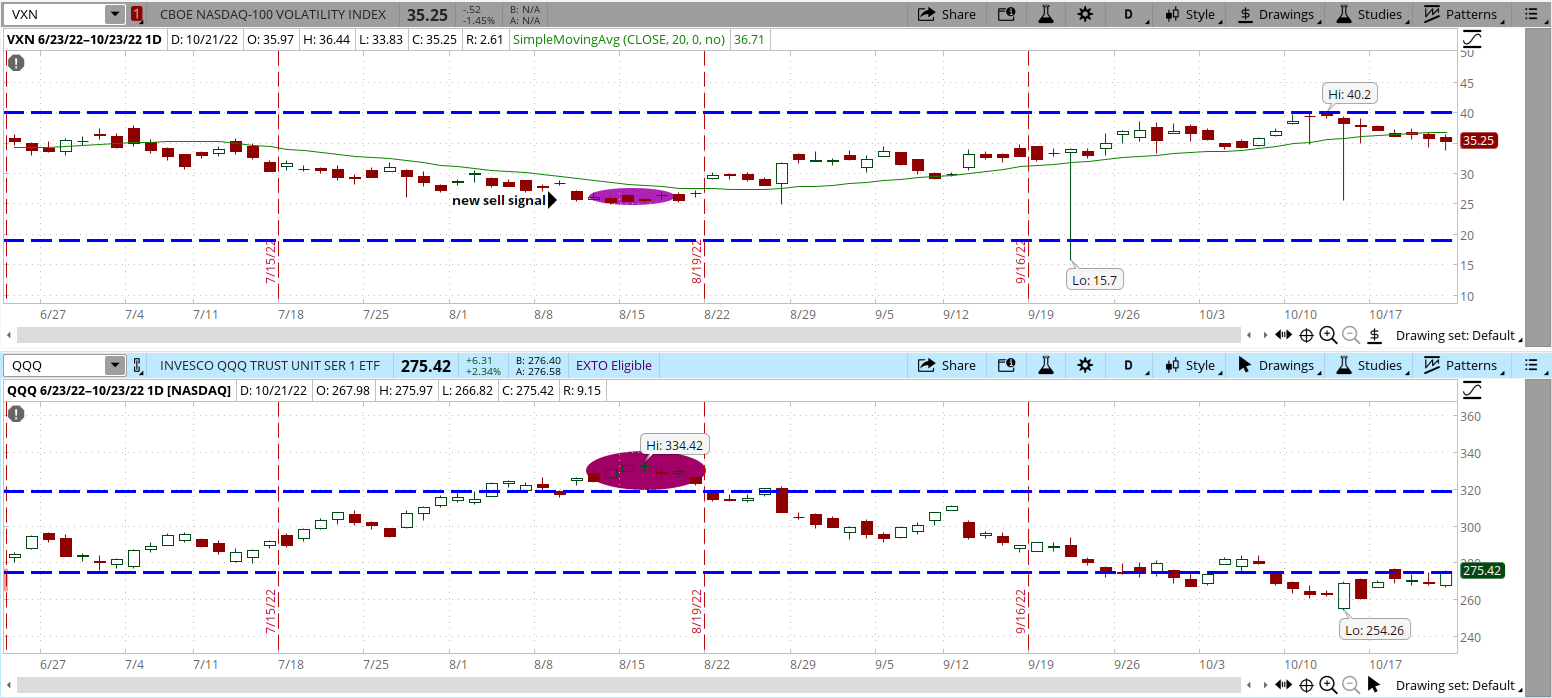
But rather than just calling tops, using an IV based methodology can be a robust market timing tool to use to help discern turning points in the overall market from both a bullish and bearish perspective.
Remember, the VIX and VXN are both measures of 30-day implied volatility (IV) in the S&P 500 and NASDAQ 100 respectively. In this article I will explore how using the VIX can greatly aid in discerning the upcoming market movement for the S&P 500 (SPY) both to the upside and the downside.
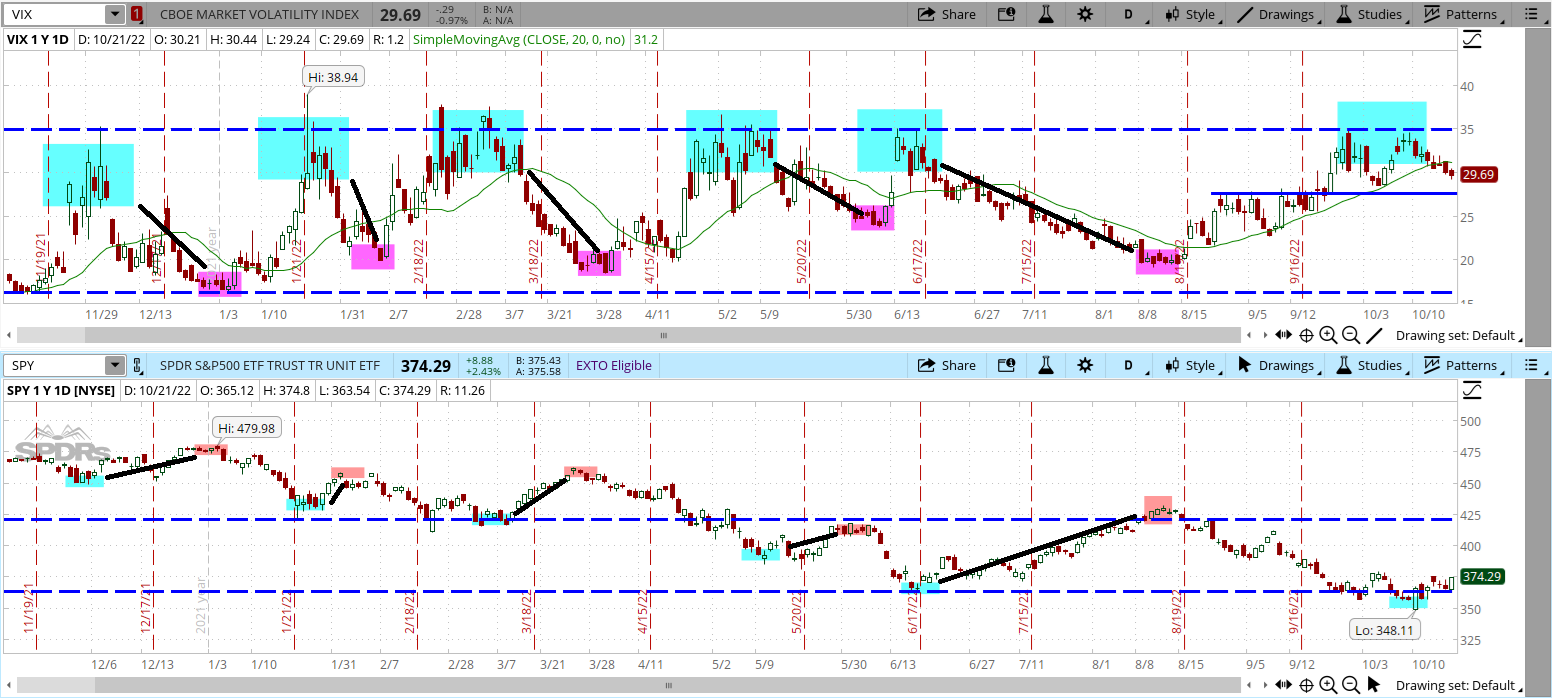
The chart below shows how extended moves higher in VIX towards 35 followed by subsequent weakness has been a bona-fide buy signal in SPY over the past year. Conversely, sharp drops lower in VIX with subsequent strength have been solid sell signals in stocks.
The table below summarizes the initial buy signal and subsequent sell signal based on this VIX methodology.
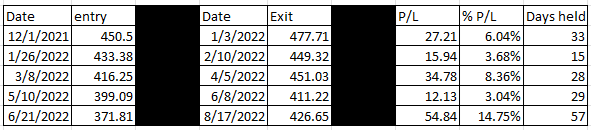
The total P/L for the 5 buy and sell signals is 35.86%, with an average gain of just over 7%. Worst gain was still 3%. Compare that to the overall loss of over 20% in the SPY over the past 12 months.
The average days held for each buy/sell signal was roughly a month. Total time held for all signals combined was less than half a year. So big gains in under 50% of the time using the VIX methodology compared to bigger losses holding SPY all the time.
A new buy signal was generated a few weeks ago as the SPY hit annual lows. No sell signal evident yet, but the unrealized gain on that latest buy signal is now over 5%.
Using the VIX to help tell whether the SPY is at a turning point is akin to the Warren Buffett adage to be greedy when others are fearful and fearful when others are greedy. Certainly, a little of the fear has come out of the market if VIX is any guide. Still haven’t reached the greedy level yet so stay tuned and see what happens over the coming weeks!
POWR Options
What To Do Next?
If you’re looking for the best options trades for today’s market, you should check out our latest presentation How to Trade Options with the POWR Ratings. Here we show you how to consistently find the top options trades, while minimizing risk.
If that appeals to you, and you want to learn more about this powerful new options strategy, then click below to get access to this timely investment presentation now:
How to Trade Options with the POWR Ratings
All the Best!
Tim Biggam
Editor, POWR Options Newsletter
Want More Great Investing Ideas?
SPY shares closed at $374.29 on Friday, up $8.88 (+2.43%). Year-to-date, SPY has declined -20.28%, versus a % rise in the benchmark S&P 500 index during the same period.
About the Author: Tim Biggam
Tim spent 13 years as Chief Options Strategist at Man Securities in Chicago, 4 years as Lead Options Strategist at ThinkorSwim and 3 years as a Market Maker for First Options in Chicago. He makes regular appearances on Bloomberg TV and is a weekly contributor to the TD Ameritrade Network "Morning Trade Live". His overriding passion is to make the complex world of options more understandable and therefore more useful to the everyday trader. Tim is the editor of the POWR Options newsletter. Learn more about Tim's background, along with links to his most recent articles. More...
More Resources for the Stocks in this Article
| Ticker | POWR Rating | Industry Rank | Rank in Industry |
| SPY | Get Rating | Get Rating | Get Rating |
| AAPL | Get Rating | Get Rating | Get Rating |
| MSFT | Get Rating | Get Rating | Get Rating |
| Get Rating | Get Rating | Get Rating | |
| Get Rating | Get Rating | Get Rating |


