

The stock market’s decline over the past few weeks has grabbed most of the mainstream headlines. But, the bigger and more worrisome move is what has occurred in the bond market.
On Monday, yield on the U.S. 10 Year Note dropped to a 50bs of 0.5% down from 1.30% just three weeks ago. This is a sign of true panic as it appears that the U.S. and global economy are headed for a recession.
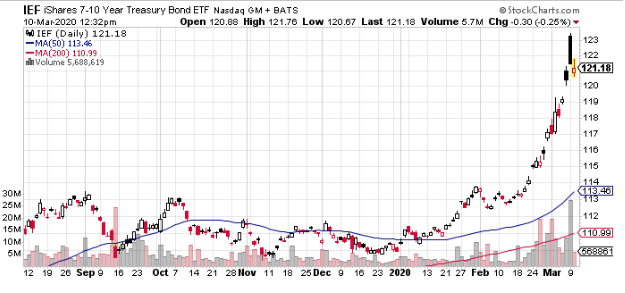
The “iShares 7-10 Year Treasury (IEF)” is a popular exchange-traded fund (ETF) that essentially tracks the 10-Year. The chart looks more like something from the dot.com or bitcoin bubbles than the $100 trillion bond market. It is simply not supposed to go parabolic. Note, as price goes up yield goes down.
The uncertainty of the full impact of the Covid19 virus led to never-before-seen moves across the debt markets, from U.S. Treasuries to leveraged loans, and municipal debt to Austria’s century bond. The last several trading sessions have resulted in a blizzard of headlines proclaiming broken records and the wildest market swings in years. It’s anyone’s guess whether such extremes can continue.
How extreme was this rally? According to relative strength index analysis, the five-year note has been “overbought” for 10 consecutive trading days, the longest stretch for the maturity since 2000. It reached the most extreme overbought level since 1998 on March 3 after the Federal Reserve’s emergency interest-rate cut of 50 basis points.
There has been a clear divergence between anything considered remotely risky, from junk bonds from U.S. treasuries. This was accelerated yesterday after a crash in oil, following the Saudi’s announcement it would slash prices and pump up output.
The energy sector, by far, constitutes the largest segment, some 40% of the high yield of the junk bond market. There is grave concern that many of the smaller and over-leveraged firms will head towards bankruptcy.
The chart below shows the extreme divergence of the IEF from the “iShares High Yield Corporate Bond (HYG), which is an ETF proxy for the junk bond market.
Adding fuel to the ‘flight to safety’ and the real fundamental concern that some issues might be insolvent is the fact that many banks or pensions fund force the need to buy bonds to either hedge exposure or meet certain allocation mandates.
For example, banks need to buy around $1.2 trillion of 10-year Treasury notes to offset risks on mortgages and bank deposits, according to “JPMorgan (JPM)” research estimates. Commercial banks own around $3 trillion of U.S. Treasury and government agency securities.
It’s often said the bond market is the ‘smart’ money compared to the stock market. If that’s the case the recent action suggests we should brace for things to turn worse, much worse before they get better.
SPY shares were trading at $279.41 per share on Tuesday afternoon, up $5.18 (+1.89%). Year-to-date, SPY has declined -13.19%, versus a % rise in the benchmark S&P 500 index during the same period.
About the Author: Option Sensei

Steve has more than 30 years of investment experience with an expertise in options trading. He’s written for TheStreet.com, Minyanville and currently for Option Sensei. Learn more about Steve’s background, along with links to his most recent articles. More...
More Resources for the Stocks in this Article
| Ticker | POWR Rating | Industry Rank | Rank in Industry |
| SPY | Get Rating | Get Rating | Get Rating |


