

(Please enjoy this updated version of this week’s commentary from the Reitmeister Total Return newsletter).
Last weeks proclamation that a new tech bubble was forming needs a bit more explanation. That’s because if I just put it out there without refinement, then folks may have a picture of a 3-4 year gung ho rally starting now. Whereas that is possible…I highly doubt that will come true. In fact, I think it would be more accurate to say we are entering a “mini-bubble” period.
I will explain why, along with more insights, to keep you on the right side of the market action.
Market Commentary
On Monday morning I put out a fresh commentary on StockNews.com that is a good complement to our recent conversations that we are seemingly in the midst of a new technology bubble for stocks. So go check it out now if you have not read it already: 3 Key Questions at this Critical Time for the Market.
I think one of the most interesting ideas shared in that article is about how lopsided this bubble is when you consider the disproportionate gains being accrued to the top 10 stocks of the S&P 500 versus the quite subdued returns for the remaining 490 stocks. And yes, those 10 stocks include all the FAANG stocks plus Microsoft, Nvidia, Adobe, and Netflix. See the wide disparity in the chart below.
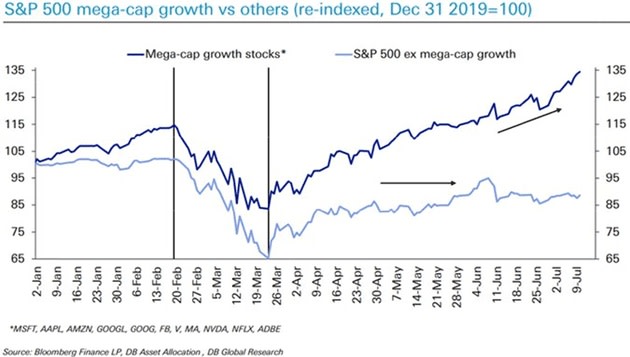
This chart tells you that investors don’t believe there is a broad based rally going on. They are just stampeding to the usual suspect tech names that just so happened to have gotten a boost from Coronavirus as more people were pushed online for work, shopping and entertainment.
Here is an interesting trend we have not spoken about yet, but is certainly playing a role in the bubble-ish action of these favored tech stocks. Without sports betting many more people are turning to the stock market to get their gambling fix. That explains record #s of new accounts opened and record trading volume. (And again this was a central feature of my article on Monday).
But going back to the bust of 1929, which was certainly a stock bubble, famed investor Bernard Baruch said that when the shoe shine boys and taxi cab drivers are talking about stocks, then it’s a sign of the top and time to sell.
The point being that when the average man is investing then it is a mania and a sign of nearing the top. Certainly there are signs of that now. The trick is knowing how late in the game we are. Looking back at the tech bubble of the late 1990’s it lasted about 3 years. So there was plenty of time to join in late and still see ample upside.
Reity, will this bubble also last 3 years?
No. I think this is just a mini bubble forming. It started a couple months ago when we simultaneously broke above 3,000 and the 200 day moving average in one fell swoop. And likely will last another couple months before the economic data rolls over and the Presidential election pulls all of the air out of the stock market discussion. So that is why I felt comfortable loading up some bubblicious tech stocks with WCLD and PNQI at this stage knowing we probably have a couple months to ride up before the pop.
Reity, why do you think the economic data is set to roll over and go negative?
I have talked ENDLESSLY in this commentary about the illusion of a V recovery that comes from an economy that was essentially shut down in March and April. This makes every ounce of re-opening of the economy look like a recovery. But once that initial pent up demand is pushed through the economy, then the economic data will likely roll over and go negative once again.
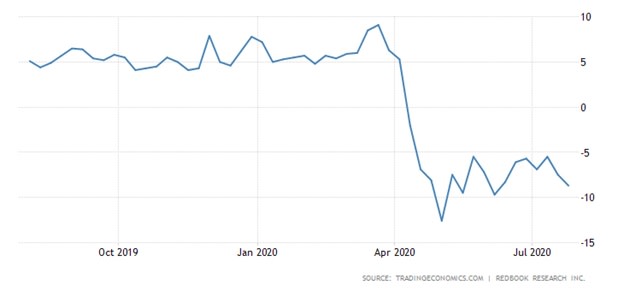
Indeed we may already been given a sign of that today with the Redbook Weekly Retail Sales report. See chart below how things bounced back from bottom in May & June, but now we have a couple weeks in a row where it is heading lower once again.
My guess is that more and more of this weakness will show up in other economic data the next couple months that SHOULD take some starch out of stock prices. But then again, if this is truly a bubble then investors will continue to ignore these signs and just keep buying until some point in the future when prices become unsustainable and it all goes POP!
I would be remiss if I didn’t also share with you the keen insights from John Mauldin this week. It truly feels like we are birds of a feather as we keep touching upon similar themes. This one being an deep dive on the valuation of stocks at this time and the potential for it to be a stock bubble. Here is the key conclusion at the end of the piece:
“If you are trading the markets, I would tighten your stops. I firmly believe you’re going to have a much better and significantly lower entry point in the future.”
Do not cheat yourself. This is another quality read from John Mauldin that you should read in full: Valuation Inflation.
Putting all the pieces together I do still think that any bubble forming will be a mini bubble. Meaning not a multi-year process like we saw in the late 1990’s with tech bubble. Here I would say we are already a few months into the process and probably by September/October it will run out of steam. First because of the economic data likely turning south once again. And second because of all the focus that will turn to the election that historically has led to a stock market sell off.
This also explains why I am stubbornly sticking to our hedged portfolio. But as I share in the Portfolio Update section below…my insistence on sticking with this portfolio is paying off handsomely.
Portfolio Update
With all this time spent over 3,200 it would seem to be quite a bullish environment. If true, then why is our conservative hedge performing so well?
+0.14% today vs. -0.65% for S&P
+2.37% the past week vs. -1.19% for S&P
+7.64% the past 6 weeks vs. +3.00% for S&P
Once again the answer is that we have bubblish conditions in a select group of stocks that push up the S&P and Nasdaq more than what is truly happening to the broader market underneath. That is why the inverse ETFs in our hedge are holding up better than expected. And then on the long side of the ledger we have all of our picks outperforming by wide margins.
Yes at some point if the bubble broadens out and brings more groups along for the ride, then we may move a bit more net long the market. But for right now, given the balance of risk and reward…and given the recent outperformance, then we will be staying the course with our hedge as is.
What to Do Next?
I know its crazy out there. And I am trying my best to help investors make sense and profit from the situation. The best way for me to do that is give you 30 days access to the Reitmeister Total Return.
This is my newsletter service where I share more frequent commentaries on the market outlook, trading strategy, and yes, a portfolio of hand selected stocks and ETFs to produce profits whether we have a bull…a bear…or anywhere in between.
And right now I continue to strongly believe bear makes a lot more sense than bull as the year progresses. Yet at the same time one has to give a nod to the bubble that is occurring for a select group of stocks.
The solution is a unique portfolio I have constructed that provides protection against the bear when it reawakens from hibernation. While at the same time leans into some of the stocks that are benefiting the most from the current bubble. That explains how we continue to top the market at this time.
Just click the link below to see all 11 stocks and ETFs in this uniquely successful portfolio. Plus get ongoing commentary and trades to adjust your strategy as 2020 continues to the wildest market in history. Gladly it can be tamed.
About Reitmeister Total Return newsletter & 30 Day Trial
Wishing you a world of investment success!

Steve Reitmeister
…but everyone calls me Reity (pronounced “Righty”)
CEO, Stock News Network and Editor, Reitmeister Total Return
SPY shares rose $0.51 (+0.16%) in after-hours trading Wednesday. Year-to-date, SPY has gained 2.05%, versus a % rise in the benchmark S&P 500 index during the same period.
About the Author: Steve Reitmeister

Steve is better known to the StockNews audience as “Reity”. Not only is he the CEO of the firm, but he also shares his 40 years of investment experience in the Reitmeister Total Return portfolio. Learn more about Reity’s background, along with links to his most recent articles and stock picks. More...
More Resources for the Stocks in this Article
| Ticker | POWR Rating | Industry Rank | Rank in Industry |
| SPY | Get Rating | Get Rating | Get Rating |
| .INX | Get Rating | Get Rating | Get Rating |
| DIA | Get Rating | Get Rating | Get Rating |
| IWM | Get Rating | Get Rating | Get Rating |
| QQQ | Get Rating | Get Rating | Get Rating |


