

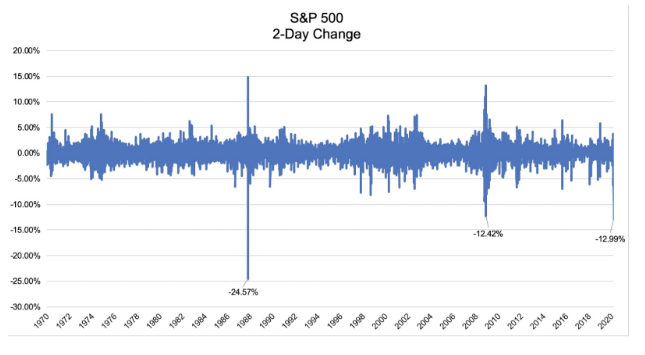
It was just three weeks that the S&P 500 (SPY - Get Rating) was at an all-time high. It has since fallen some 30% as the Covid19 virus has turned into a pandemic, threatens to shut down large swaths of the global economy and created high levels of uncertainty. This would be the quickest and steepest decline on record and includes the second largest 2-day decline, surpassing even the worst days of the financial crisis. Only worse was the crash, or black Monday in 1987.
This rapid decline, which has seen with a handful of rip-roaring rallies within the larger sell-off, has caused the “Chicago Board of Options (CBOE)” Volatility Index, known as the VIX, to surge to near records, also only seen during the financial crisis and Black Monday.
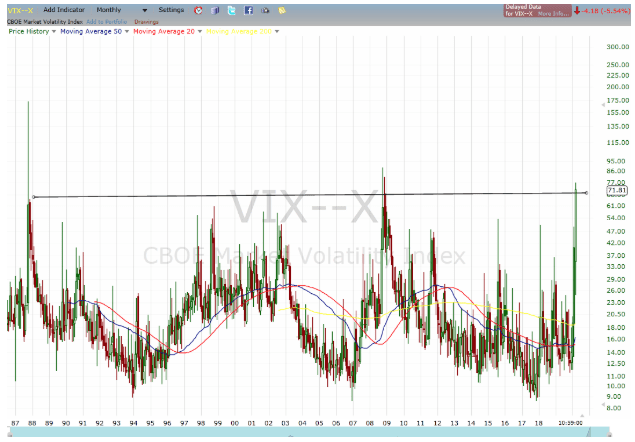
The VIX currently sports a value of 70%, indicatiung that the options market is expecting or ‘pricing in’ a 4.2% daily move. Over the past 15 days, trading the S&P 500 has had 7 days above 4.5%, including Thursday’s 10.3% decline. Remember, the days that we barely saw half-percentage moves? It seems like a long time ago.
This is one of the rare instances in which realized volatility is surpassing implied volatility. I’ll get to how we arrive at the specific formula for calculating the expected move. But first, a more general discussion on how we define volatility and what it can tell us about options pricing behavior.
What sometimes gets lost in the broad discussion of VIX is the specifics of how implied volatility gets factored into individual option prices and impacts position profitability? The term volatility gets thrown around a lot and is often used interchangeably for big moves, especially down, or perceived risk.
But for options traders, volatility, or more specifically implied volatility, has very defined meaning and is crucial to understanding the probability of profitable trading. I often use the analogy that you don’t need to be a mechanic or know how to build an engine to drive a car, just know the gas from the brake, but having a rudimentary understanding of how the parts work and connect can help not only avoid accidents, but also enhance performance.
Likewise, you don’t need to get all geeked out on the Black-Scholes model to trade options. But having a basic understanding of how options get priced and behave under a variety of conditions will go a long way to successful trading.
Let’s take a look under the hood of what we mean when we talk about implied volatility.
Implied volatility is a ‘plug number’ (a placeholder number used to make the calculation estimate correct) used to make the result from the commonly-used apparatus for valuing options, which is the Black-Scholes model. It considers five factors in calculating a particular option’s theoretical fair value:
1. The price of the underlying security
2. The strike price
3. The time, or expiration date of the option
4. Interest rates * This is becoming increasingly important in the rising rate environment and with upcoming FOMC meetings
5. Implied volatility
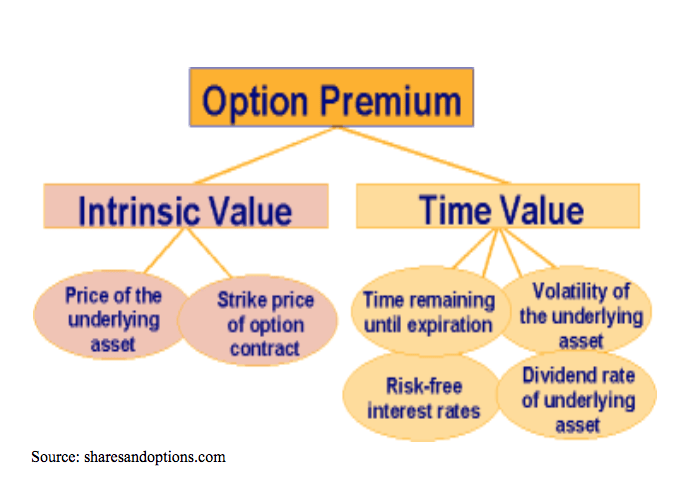
The first four inputs are known variables. To get number five, we plug those four inputs into the Black-Scholes model, giving us “theoretical” implied volatility, which helps us decide whether an option is cheap or expensive.
But, given that options trade regularly, there is already an “actual” implied volatility assigned to each option based on its price, which is constantly updating in real-time.
So, what does the actual or real-time implied volatility tell us?
- IV is a proxy for standard deviation
- Price should remain within one standard deviation of 68% of the time.
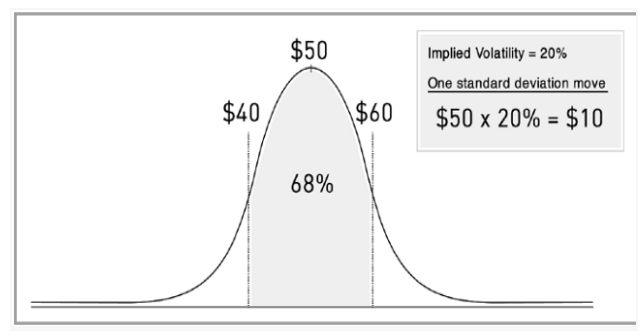
So, a one standard deviation move = $50 x 20% = $10. Meaning, shares are expected to stay within $40 to $60 for the year.
To narrow this down to shorter time frames, we use this formula. This brings us to the ‘rule of 16’ in which you take the square root of the 256, number of trading days in a year or 16, to calculate the expected daily move.
Hence;
- 25% IV on a $100 stock remains within $75-$125 for year 68% of the time.
- 25% IV: (25/16)=1.56% daily price move.
Again, with VIX currently at 70%, it predicting a 4.3% daily price move for the “SPDR 500 (SPY - Get Rating)”
Right now, we are in an interesting place; volatility, both real and implied, are at record levels and historically these are short-lived spikes. But, with so much still unknown how the virus will play out or over what time frame we are likely to have above-normal volatility for an extended period. Knowing how this will impact your positions will help them become more profitable.
SPY shares were trading at $255.25 per share on Friday afternoon, up $7.14 (+2.88%). Year-to-date, SPY has declined -20.70%, versus a % rise in the benchmark S&P 500 index during the same period.
About the Author: Option Sensei

Steve has more than 30 years of investment experience with an expertise in options trading. He’s written for TheStreet.com, Minyanville and currently for Option Sensei. Learn more about Steve’s background, along with links to his most recent articles. More...
More Resources for the Stocks in this Article
| Ticker | POWR Rating | Industry Rank | Rank in Industry |
| SPY | Get Rating | Get Rating | Get Rating |


