As of last night’s close, the S&P 500 is now down over 17% so far this year. The Russell 2000 is down even more, dropping nearly 23%. NASDAQ 100 has been the worst performer of the big three indices with a loss of 27% so far in 2022.
The selling seems to continue unabated. The S&P 500 hit a 3-month low in May for the fifth calendar month in a row. This is the first time that has happened since 1974.
‘Buy the Dip’ has turned into ‘Sell the Rally.’ TINA (There Is No Alternative) that fueled stocks higher when rates approached zero has all but been forgotten. Volatility has reached an extreme. But volatility begets opportunity…
Markets may be nearing an opportune time to pick up some beaten-down and battered stocks at bargain, or at least more attractive, prices than just a few weeks ago.
What gives me this optimism?
My 30+ years of experience in the stock and option markets.
The current environment of fear along with more attractive valuations and historically oversold markets from a technical perspective sets up ideally for a meaningful low being formed sometime soon.
Let’s take a walk through these three components and see why markets may be beginning to brighten a little going forward.
Fear Factor
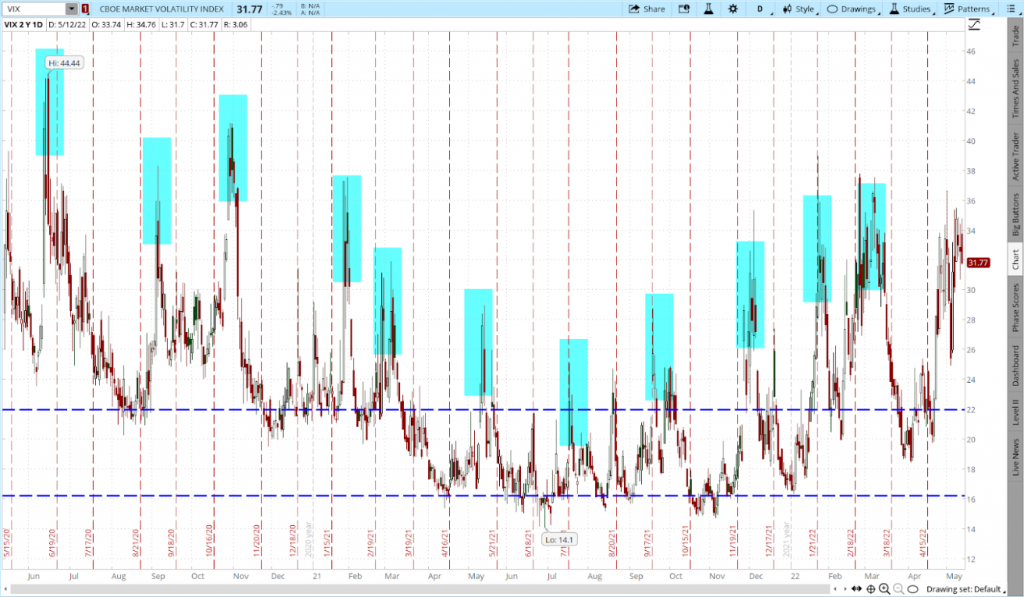
The CBOE Volatility Index, better known as the VIX, is a real-time measure of future expected volatility based on S&P 500 option prices. The VIX tends to correlate inversely with stock prices. When stocks go up, VIX generally goes down. And as we are seeing lately, when stocks go down, VIX goes up.
It is called the “Fear Gauge” since it tends to spike most when investors are the most fearful. The VIX closed at 31.77 Thursday which was actually down slightly. The VXN, or VIX of the NASDAQ 100, closed at the highest level of the year on Thursday. The fear is definitely here.
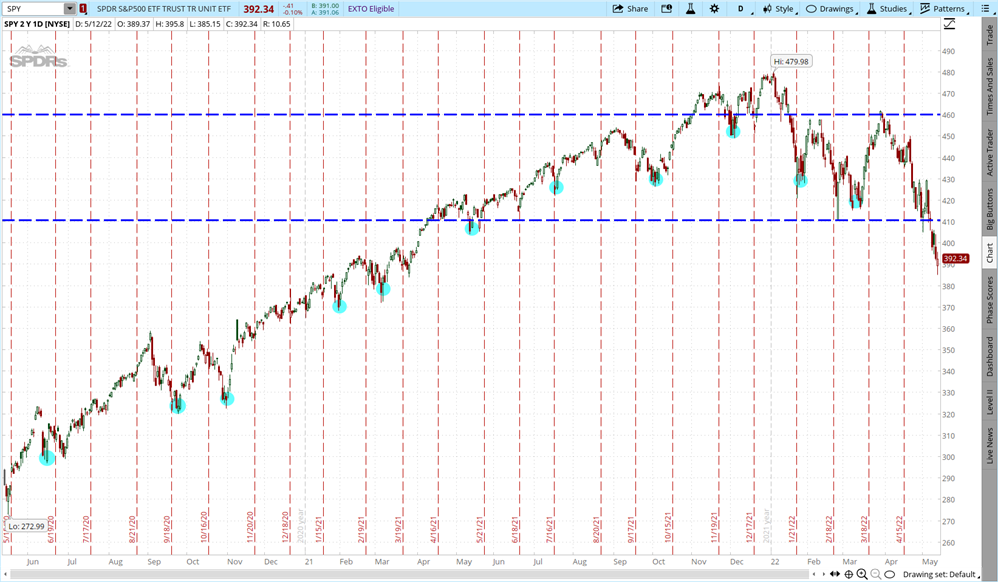
Note how the spikes in VIX tend to reverse, or revert to the mean, fairly quickly. You can also see the spikes in VIX correlate with significant short-term lows in the S&P 500 (SPY). See if history repeats itself once again with the latest VIX spike and marks yet another short-term low in the market.
CNN developed a Fear and Greed Index to ascertain investor sentiment. The Fear & Greed Index is a compilation of seven different indicators that measure some aspect of stock market behavior.
They are market momentum, stock price strength, stock price breadth, put and call options, junk bond demand, market volatility, and safe haven demand.
The index tracks how much these individual indicators deviate from their averages compared to how much they normally diverge. The index gives each indicator equal weighting in calculating a score from 0 to 100, with 100 representing maximum greediness and 0 signaling maximum fear.
Right now it is flashing extreme fear with a reading of just 6!
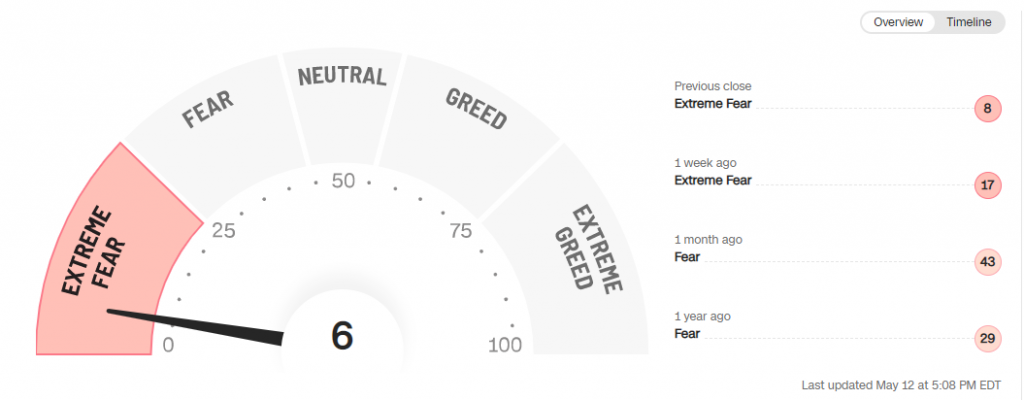
(Source: CNN.com)
Warren Buffet famously said, “Be Greedy When Others Are Fearful”. Nathan Rothschild opined that the time to buy is when there’s blood in the streets. Certainly, the fear is becoming more palpable each day. The time to buy may very well be close at hand.
Valuations Getting More Attractive
Let’s look at the two biggest stocks going, Apple (AAPL) and Microsoft (MSFT), as a proxy for stocks generally. Apple began 2022 with a P/E multiple of 29. Currently it stands just under 24.
Microsoft stock had a P/E over 33 to start the year. Now it is under 27. Sure, interest rates are higher-which has a contractive effect on valuation multiples like P/E. Although rates are higher and rising, they are still historically on the low side even after the two recent Fed rate hikes.
Both AAPL and MSFT have beaten earnings handily each of the past four quarters yet both stock prices are now markedly lower than four quarters ago. The combination of a lower price -P- and better earnings -E- makes for a much lower and more attractive P/E ratio.
The 10-year yield is now back well below 3% after briefly getting to the highest level since 2018 at 3.14%. This pullback in rates should eventually help to buoy stock valuations just as it drove valuations lower during the recent rise.
Interesting to note that AAPL just lost the title of world’s most highly valued company to oil behemoth Saudi Aramco. Maybe another sign that we are approaching a tradeable low in the U.S. stock markets.
Technicals Deeply Oversold
Since we are examining AAPL and MSFT from a valuation standpoint, I think it is appropriate to look at the NASDAQ 100 (QQQ) from a technical standpoint. Apple and Microsoft are by far the two biggest companies by market cap in the ‘Nazzy.’
Some of you perhaps will remember one of my previous articles on technical analysis where I took a dive into my simple and straight-forward approach. I am using the same methodology here to show just how oversold stocks have become.
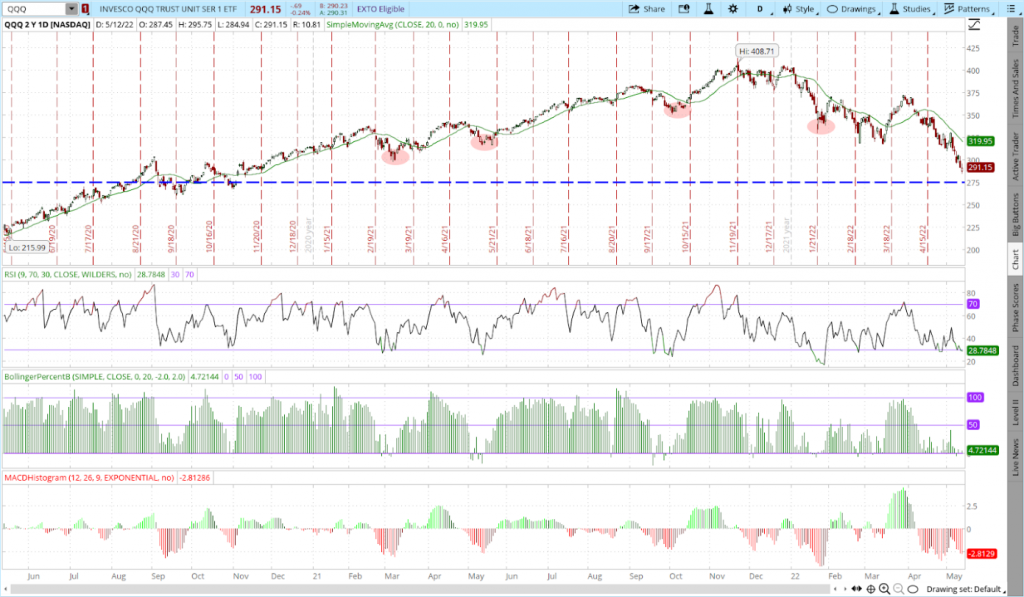
The chart above is a daily two-year chart of the QQQ. 9-day RSI is now under 30 which is the traditional oversold metric. Bollinger Percent B went negative but has since recovered slightly. MACD reached a recent extreme as well.
QQQ is trading at a huge discount to the 20-day moving average. The last times all of these indicators aligned in a similar fashion marked significant short-term lows in the QQQ (as highlighted in the rose-colored ovals).
There is major downside support looming at the $275 area. Yesterday was also the first day in the last six where QQQ closed above the opening price. This is many times a sign that a reversal is in the offing.
The S&P 500, Russell 2000 and other major indices all paint a similarly oversold technical picture.
It has been dark to say the least the past several weeks in the stock market. However, it’s important to remember that it is also “darkest just before the dawn.”
It looks like an opportune time to start making a laundry list of stocks to add to the portfolio at much more attractive levels than any time in recent memory.
What To Do Next?
The recent market volatility market has been unsettling for most investors, but it has also created some unique opportunities…
With the quantitative muscle of the POWR Ratings as my starting point, I’ve uncovered some of the best options trades in this difficult market.
That’s because I take advantage of both call and put options trades to generate big gains in all market conditions. Yes even the volatile markets we’ve experienced recently.
In fact since launching the service in November 2021, I have delivered a market beating +101.4% return for subscribers to my POWR Options newsletter.
The good news is that you can become a subscriber today, by starting a 30 day trial for just $1.
During your $1 trial you’ll get full access to the current portfolio, weekly market commentary and every trade alert by text & email.
Plus I’ll be adding the next 2 exciting options trades (1 call and 1 put) when the market opens this Monday morning, so start your trial today so you don’t miss out!
There’s no obligation beyond the 30 day trial, so there is absolutely no risk in getting started today.
About POWR Options & $1 Trial >>
Here’s to good trading!
Tim Biggam
Editor, POWR Options Newsletter
Want More Great Investing Ideas?
SPY shares were trading at $401.41 per share on Friday afternoon, up $9.07 (+2.31%). Year-to-date, SPY has declined -15.22%, versus a % rise in the benchmark S&P 500 index during the same period.
About the Author: Tim Biggam

Tim spent 13 years as Chief Options Strategist at Man Securities in Chicago, 4 years as Lead Options Strategist at ThinkorSwim and 3 years as a Market Maker for First Options in Chicago. He makes regular appearances on Bloomberg TV and is a weekly contributor to the TD Ameritrade Network "Morning Trade Live". His overriding passion is to make the complex world of options more understandable and therefore more useful to the everyday trader. Tim is the editor of the POWR Options newsletter. Learn more about Tim's background, along with links to his most recent articles. More...


