

In most of 2019, the US economy beat expectations. Combined with the Fed’s accommodative stance and December’s 2018 bear market low like valuations, this helped drive stocks in 2019 to a 31.5% rally that was the second-best in 20 years.
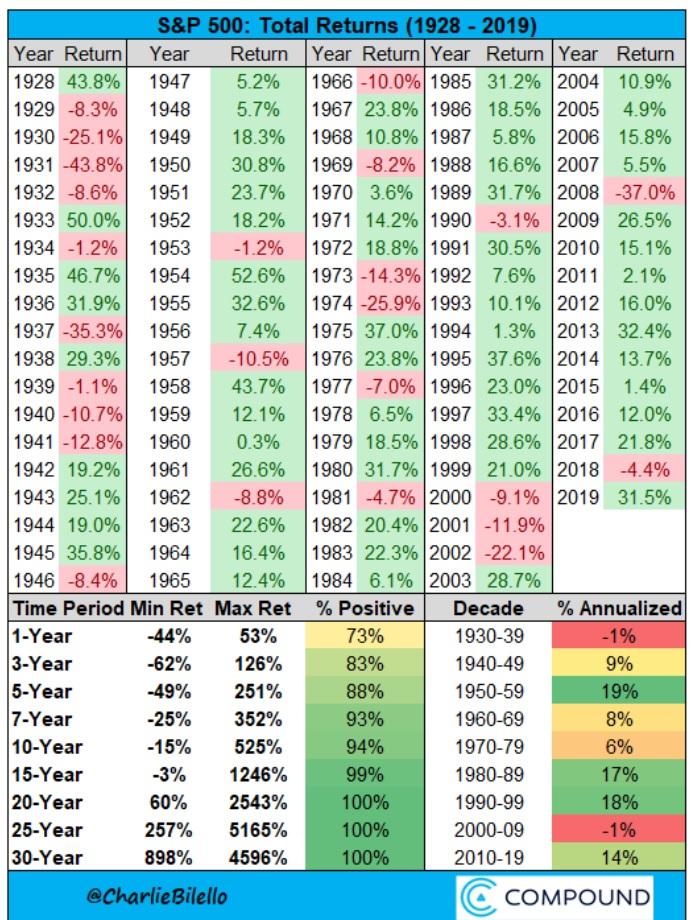
However, whether or not stocks can continue their strong rally in 2020 largely depends on whether economic growth can continue to beat consensus expectations of about 1.5% growth for this year.
GDP Consensus From 15 Most Accurate Economists
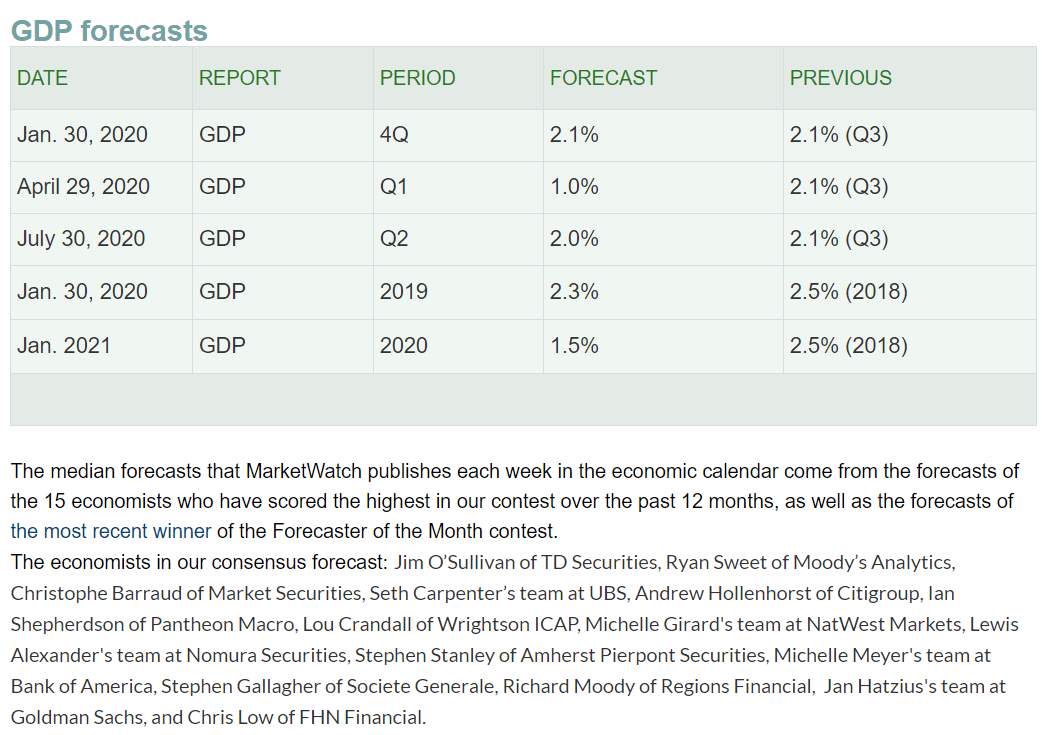
(Source: Marketwatch)
1.5% consensus growth in 2020 would be the weakest year of growth since 2009 and makes the almost 10% EPS growth consensus FactSet Research is reporting unlikely.
So here are two critical facts investors need to know about the latest economic news and what it likely means for your portfolio.
Fact #1: The Economy Continues to Weaken
The single most useful tool for screening out the noise about the US economy is David Rice’s Baseline and Rate of Change or BaR economic grid, which is updated every Friday.
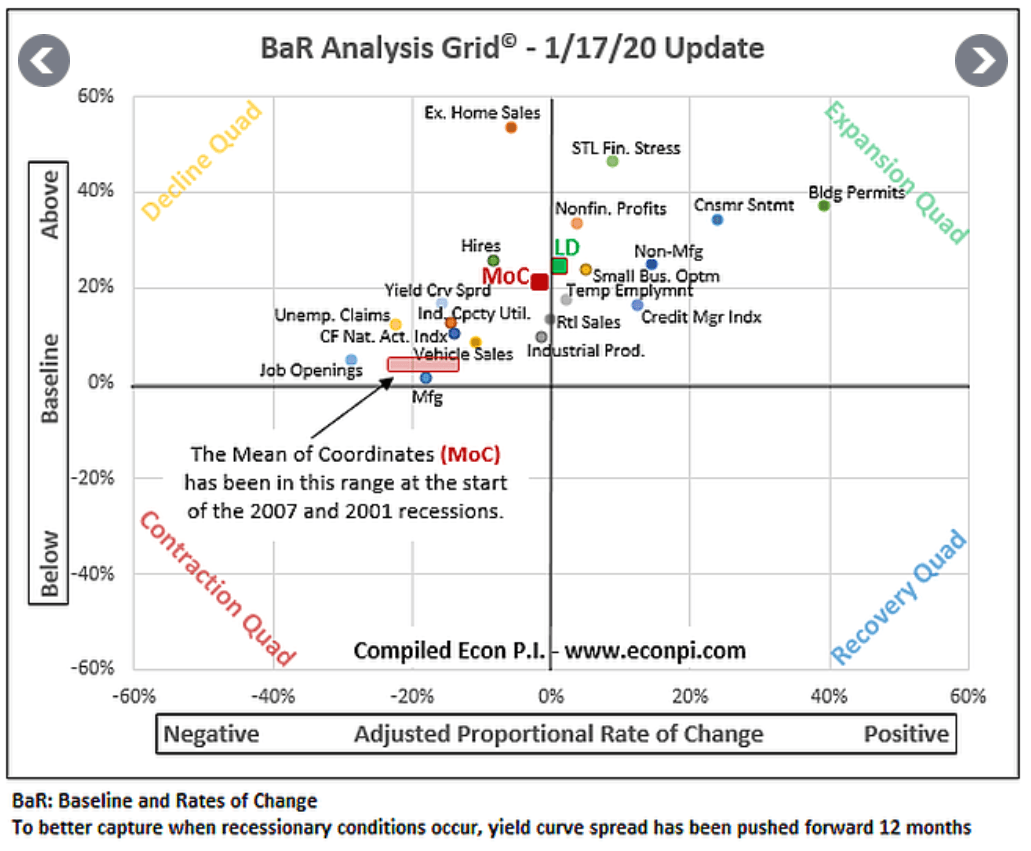
(Source: David Rice)
The reason I consider the BaR grid the gold standard in economic data tracking is because the 19 leading economic indicators it monitors represent over 100 economic reports.
Tracking the position of each above historical recessionary baseline and how rapidly each changes month to month is the most objective way I’ve yet found of estimating what’s happening with America’s $22 trillion economy.
Rather than cherry-pick individual reports or economist/analyst recession risk estimates, this grid and its stats table, let us just watch the data as it comes in.

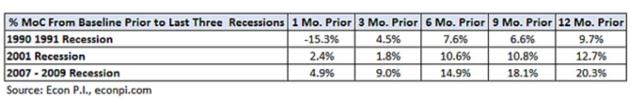
This is the stats table for BaR that gets updated every two weeks.
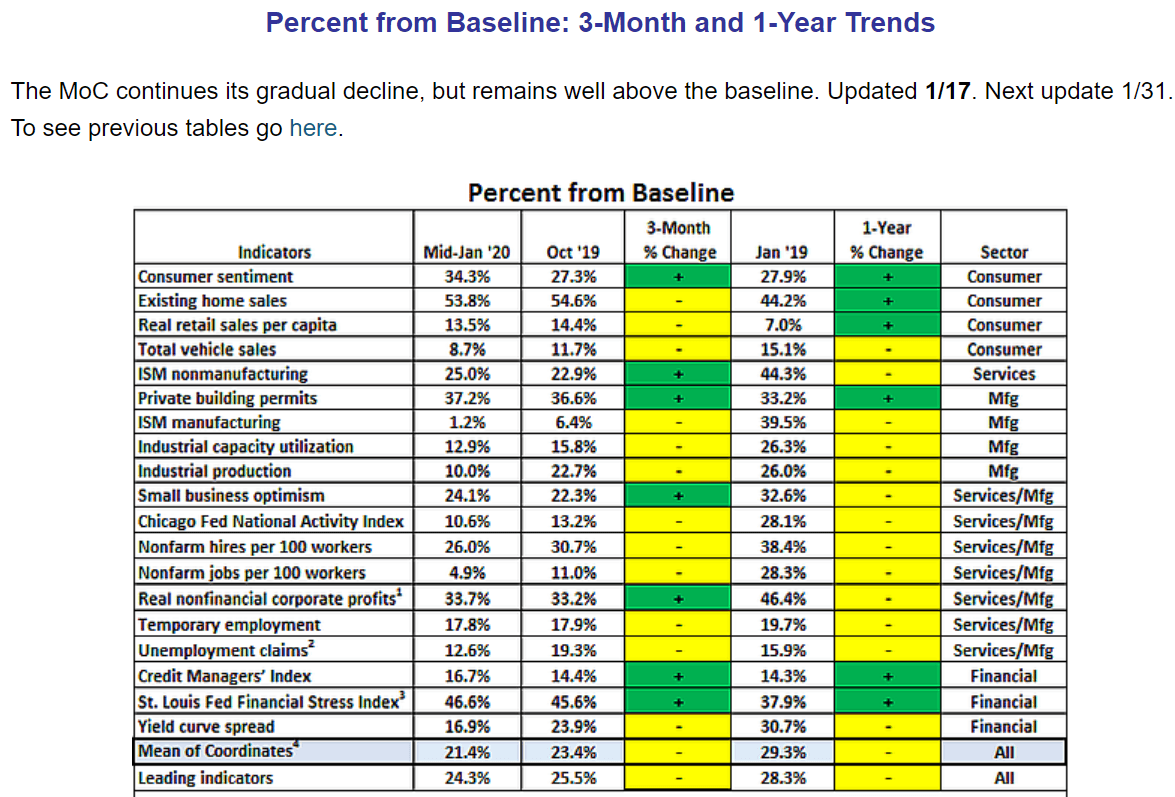
(Source: David Rice)
It lets you see how far above the recessionary baseline each indicator is and how that compares to three and 12 months ago.
Not surprisingly, manufacturing is firmly in a recession right now and trending lower at nearly 20% month over month. The good news is that plenty of other indicators associated with housing, services, and the labor market remain strong.
Thus the average of all indicators (the mean of coordinates or MoC) is 21.4% above baseline.
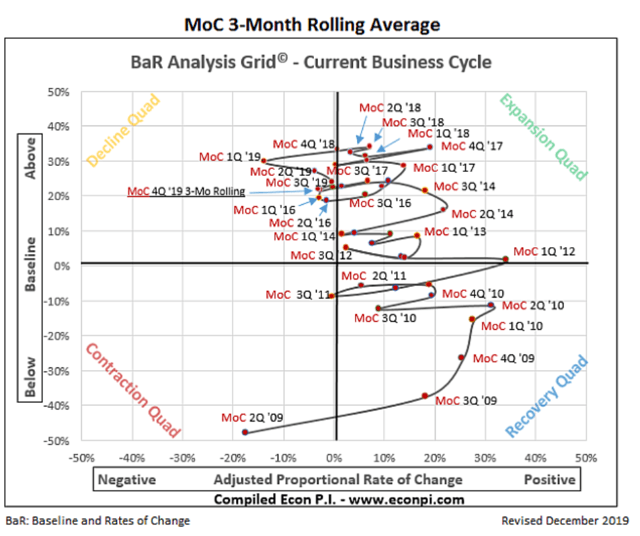
(Source: David Rice)
That’s still the lowest we’ve seen since 2016 and 10% below the Q3 2018 peak. But even without a trade conflict economists fully expected 2018’s 2.9% GDP growth to slow drastically as fiscal stimulus wore off.
Fact #2: 2020 Recession Risk Is Very Low And 2021 Risk Is Moderate
Just because we’re on track for about 1.5% GDP growth in 2020, the weakest year since 2009, doesn’t mean recession warning bells should be ringing.

(Source: David Rice)
This is what the grid looked like before the Great Recession, with the MoC near recessionary levels, and the eight most sensitive indicators even lower, and contracting at nearly 20% month to month.
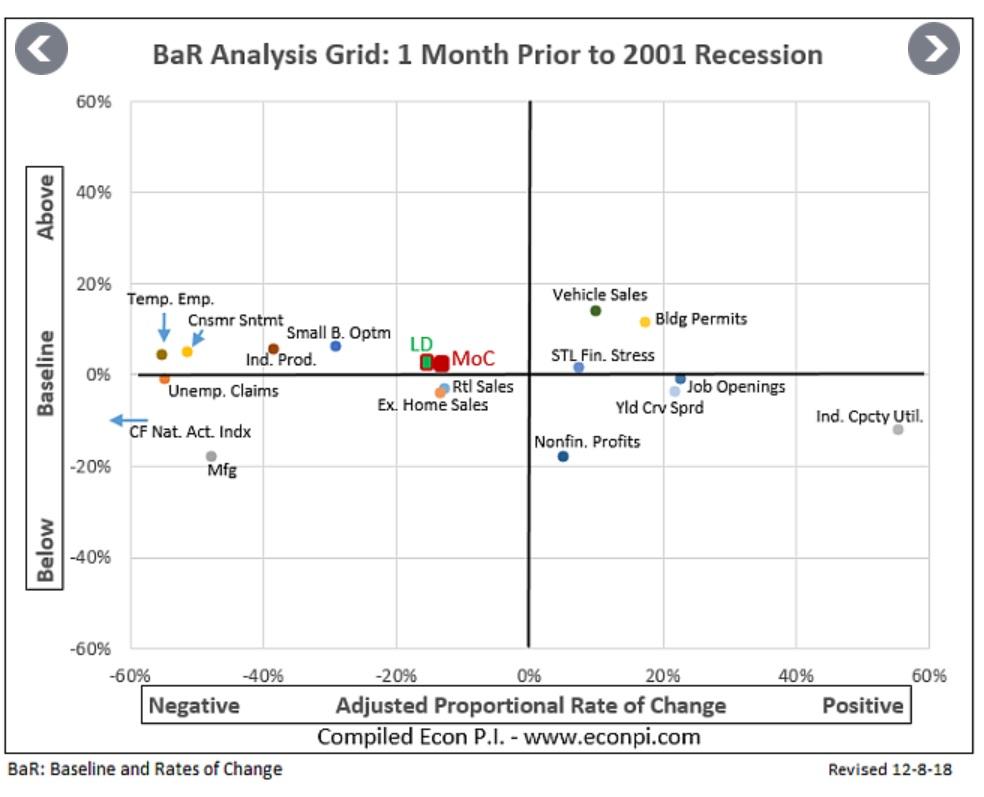
(Source: David Rice)
Before the mildest recession in 60 years, this is what the grid looked like.
(Source: David Rice)
According to Mr. Rice, which I’ve confirmed with private discussions with him, 20% and 15% are the key tipping points to watch.
- 20% or below = growth is likely to keep slowing
- 15% or below = recession (within 6 to 18 months) becomes the most likely outcome
Right now 21.4% above recessionary baseline is just enough to cause me to pull back my weekly stock buying from $750 to $500 per week. I continue to buy every week and in fact, have 20 limit orders in place for five high conviction stocks right now.
One of those limits just went off, leaving me with $1000 in dry powder to buy two of those limits. The reason 80% of my monthly savings go into my dry powder pool rather than weekly buys is that my Master List is 360 companies and earnings season brings plenty of volatility.
Should the MoC fall below 20% then I’d pull back weekly buys to $250 but continue putting virtually all my savings to work through opportunistic limit orders. $250 is the least I’ll buy each week, regardless of how the economy is doing.
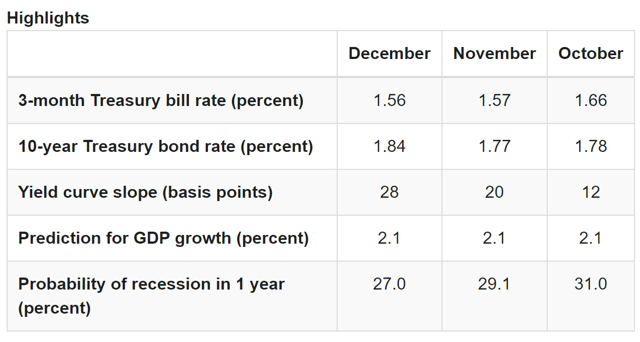
(Source: Cleveland Federal Reserve)
According to the Cleveland Fed/Haver Analytics yield curve GDP growth/Recession Risk model at a yield curve slope of 28 bp, the 12-month recession risk is 27%.
I have a real-time 13-month model based on the Cleveland Fed model, that takes the current yield curve (20 bp) and then applies the rate of recession risk change per bp of yield curve slope.
In other words, if today’s +20 bp curve were to persist for 30 days, it would become the new monthly average and thus implies that the bond market thinks the probability of a recession beginning in February 2021 is about 29%. That happens to also be November’s average slope and risk.
That’s down from 48% in early September but up from 25% a few weeks ago.
What does that mean for investors? Most likely the next market pullback/correction will be a run-of-the-mill affair, and not the start of the next great market crash.
(Source: Guggenheim Partners)
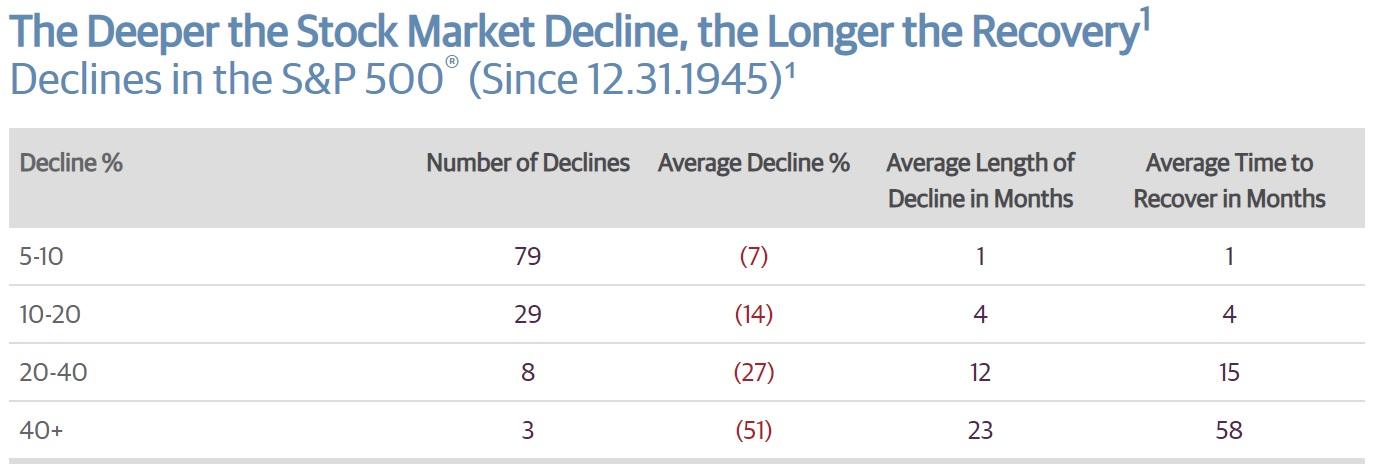
While each downturn is different historically speaking here is what you can expect from stocks over time.
- a 5+% pullback/correction every six months
- average 5% to 9.9% pullback is a 1-month 7-month decline
- average pullback lasts two months measured from market high to new record high
- average correction lasts eight months, four-month 14% decline, and four-month recovery to new highs
While not every year sees a pullback or correction, since 1990 the average intra-year peak decline has been 13.8%.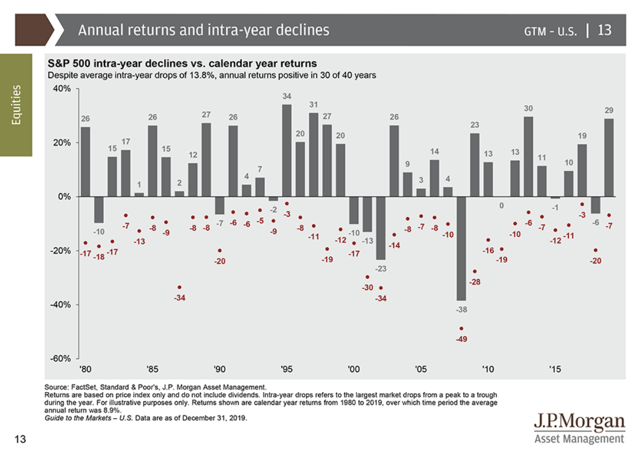
Does a lack of a recession mean that bear markets can’t happen? Of course not.
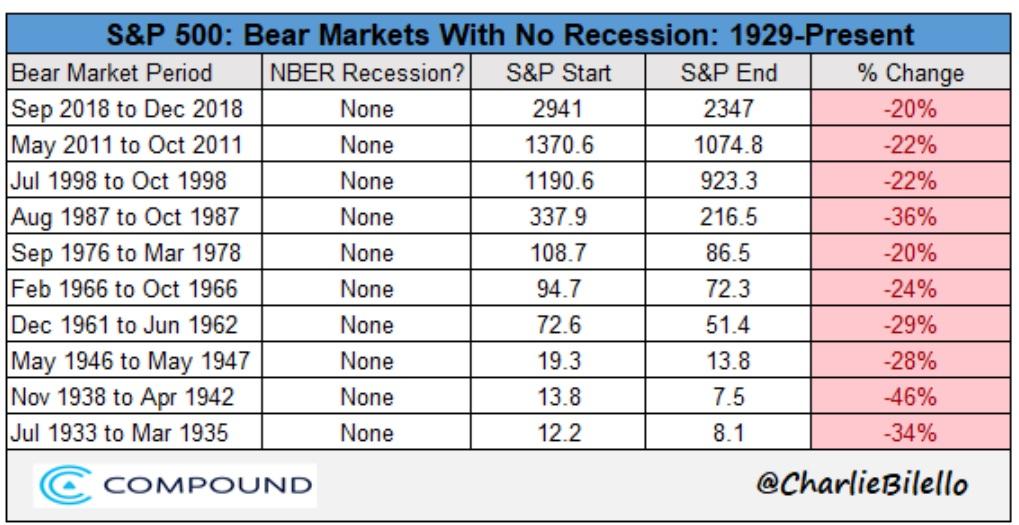
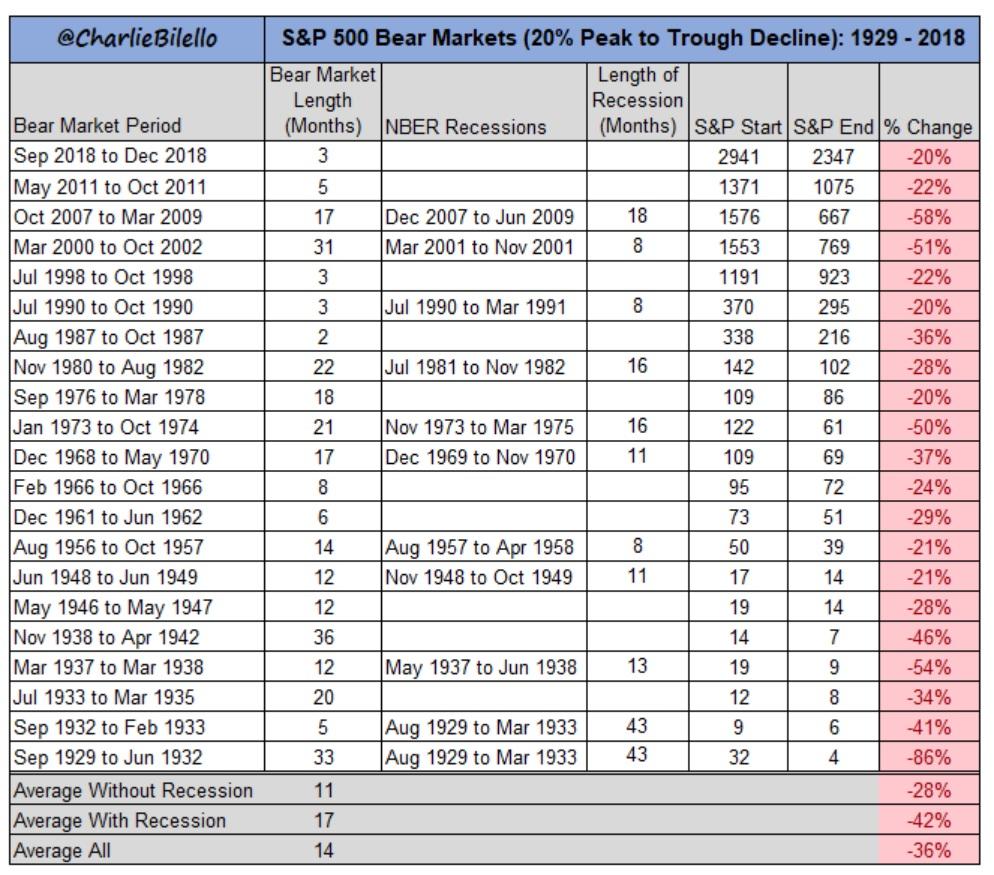
Here’s a table of non-recessionary bear markets, using intra-day peak decline prices. The S&P 500 closed down 19.8% on December 24th, 2018 which is why the bull market is still alive.
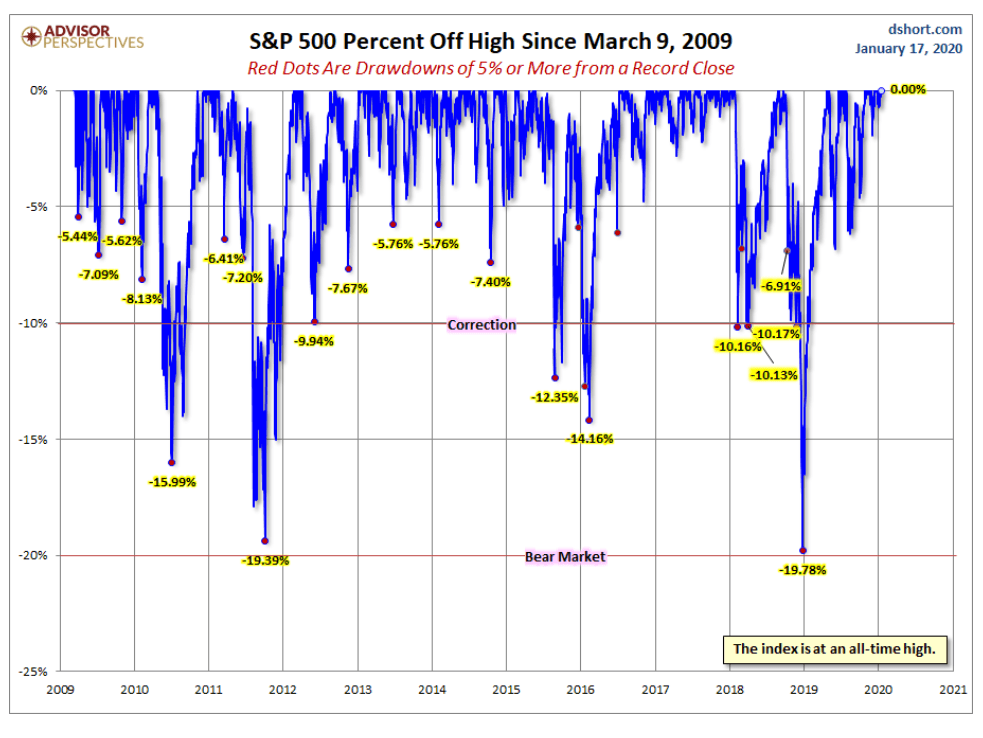
(Source: Advisor Perspectives)
But the point is that 48% of the 20+% peak declines since 1926 have been outside of recessions. Non-recessionary bear markets are, on average ix months shorter and 14% milder than recessionary ones.
Does that mean investors should try to use economic data to time the market? Absolutely not. Nothing justifies market timing which is the absolute worst thing you can do.
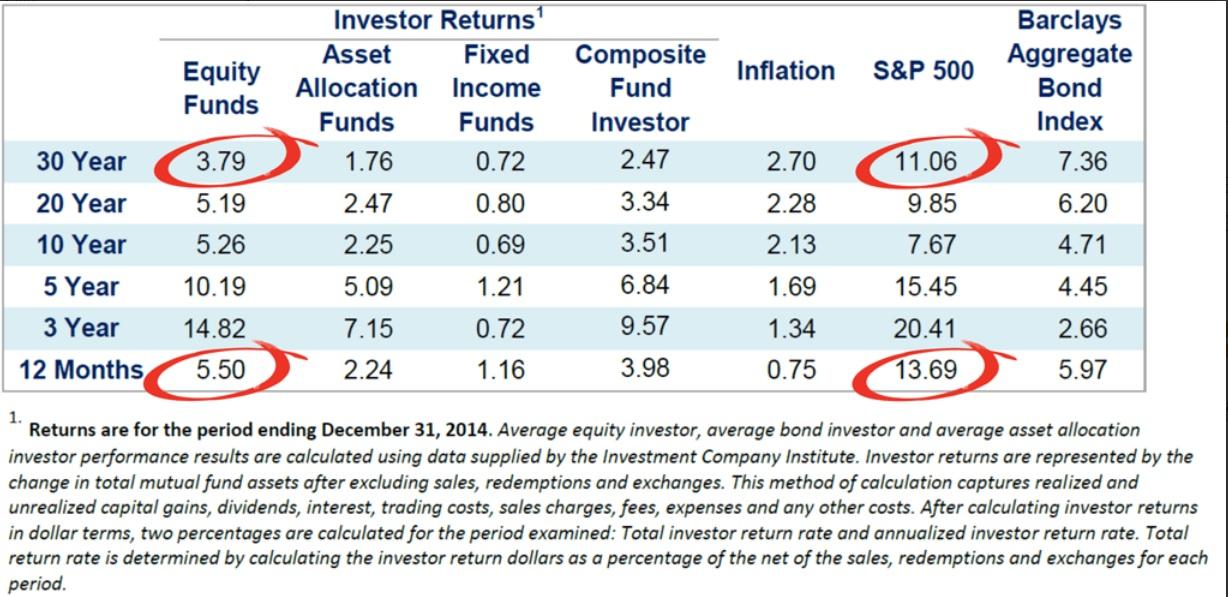
(Source: Dalbar)
Over the last 30 years, but across all time periods, whether stock or bond funds, average investors have significantly underperformed.
In inflation-adjusted terms, market timing a 60/40 stock/bond portfolio would have resulted in -55% total returns compared to a 474% total return had you just bought and held.
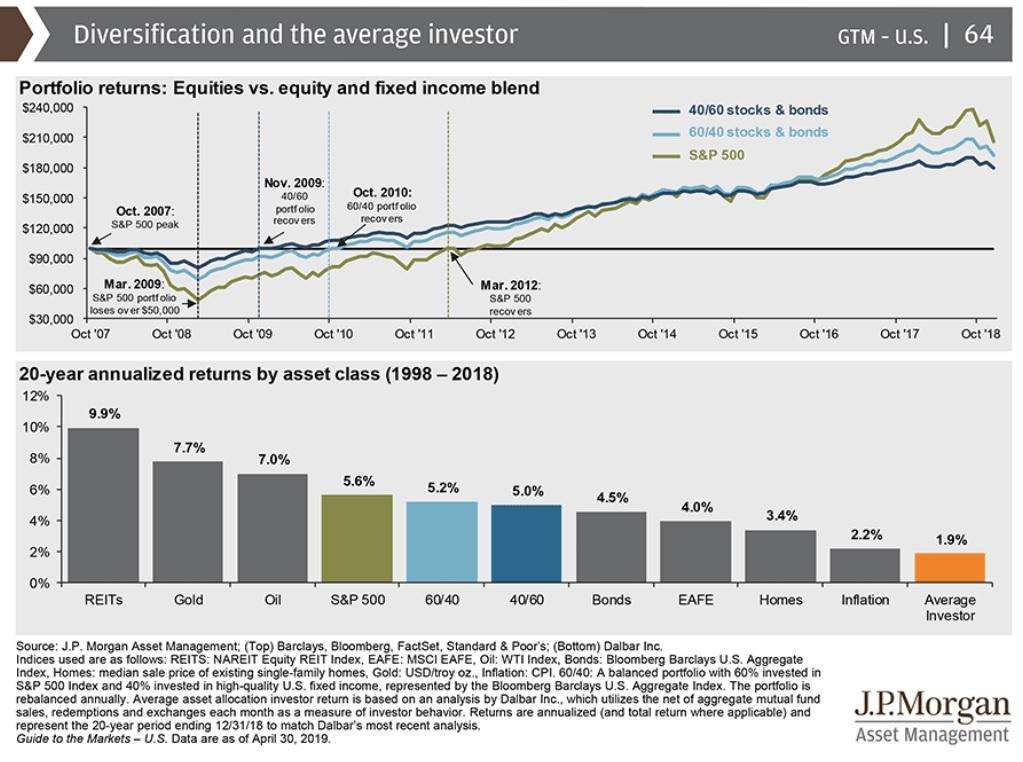
JPMorgan, the 4th largest asset manager on earth, similarly confirms that market timing is a disaster for most people.
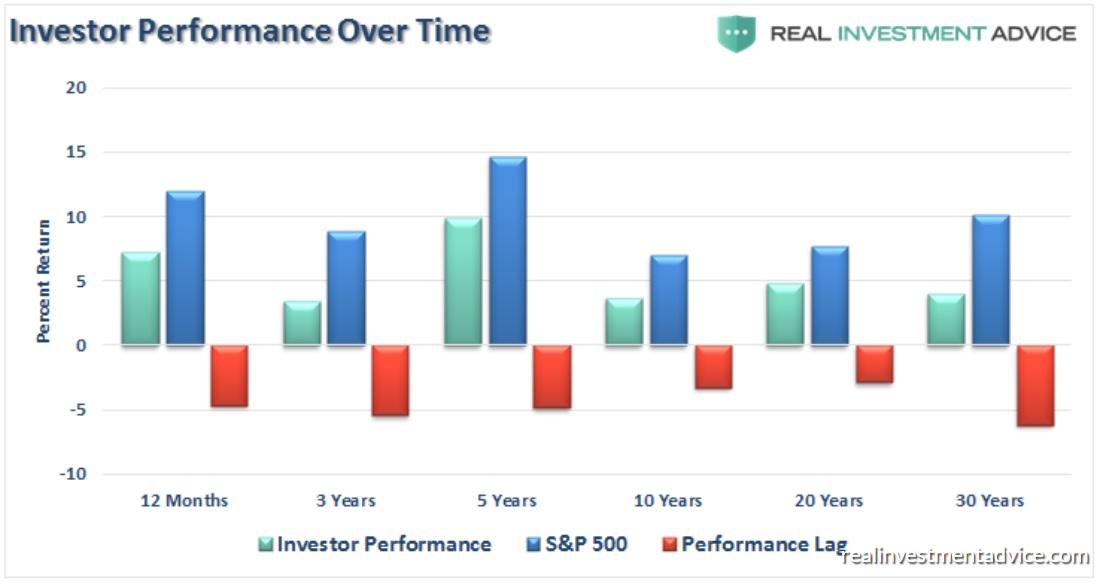
(Sources: Dalbar, Lance Roberts)
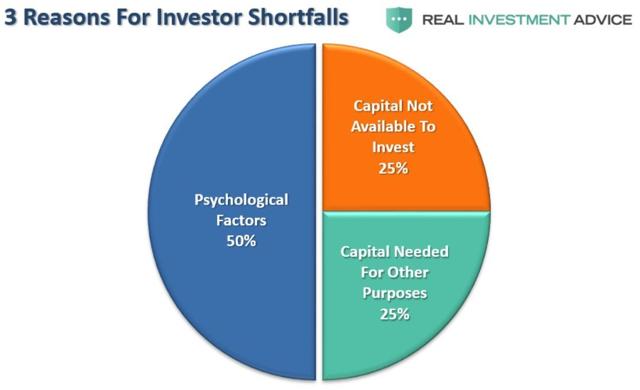
75% of the reason investors underperform comes down to improper risk management, resulting in fear-induced panic selling or becoming a forced seller by financial necessity.
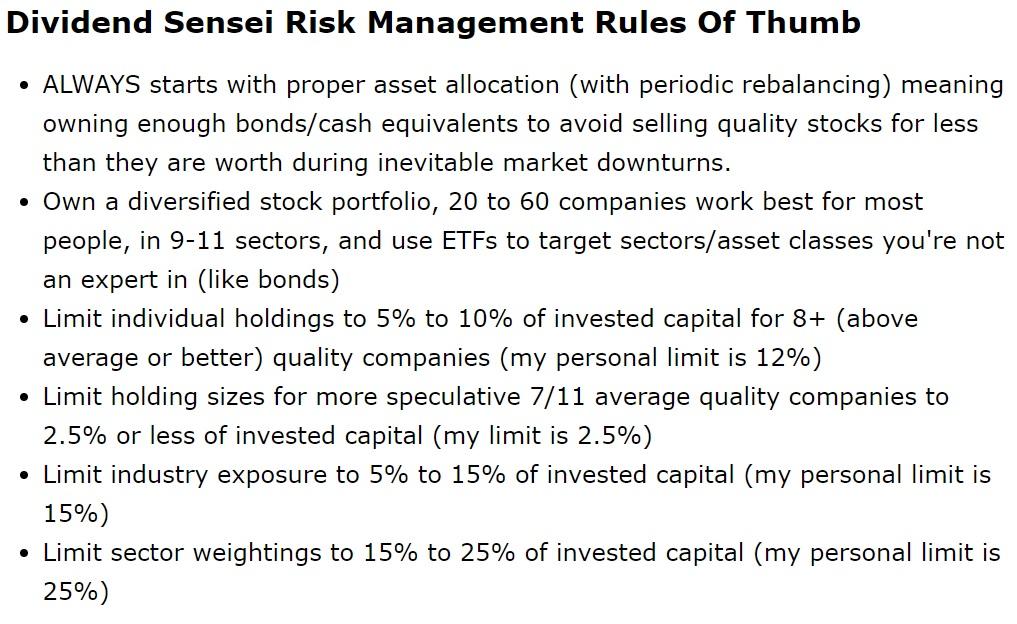
These are the risk management guidelines I use to run all the Dividend Kings model portfolios and my retirement portfolio.
Those are designed to allow me and our members to sleep well at night no matter what happens with the economy or broader market.
Bottom Line: The Economy Continues to Weaken, Meaning Investors Need to Better Trust a Risk-Managed Long-Term Plan
As part of my job, I track the state of the economy and broader market very closely on a weekly basis.
That’s so I can keep my readers apprised of what’s most likely to happen over the next year or two. Not because I try to market time or guess what stocks will do over the next year, but purely to help you avoid making costly mistakes that could crater your long-term financial goals.
Objective reality is that the US economy continues to slow right now, though recession remains very unlikely in 2020 and 2021 recession risk is only moderately high.
Rest assured that if things continue to get worse I’ll provide plenty of warnings that should give us at least six to 18 months headway before an economic contraction occurs.
That will hopefully give you time to prepare financially and emotionally for nasty market declines, though they are unlikely to be anywhere close to the 50% crashes seen in 2000 or 2007.
In the meantime, the prudent course for nearly all investors to take is to focus on their own needs and work towards maintaining a diversified and prudently risk-managed portfolio.
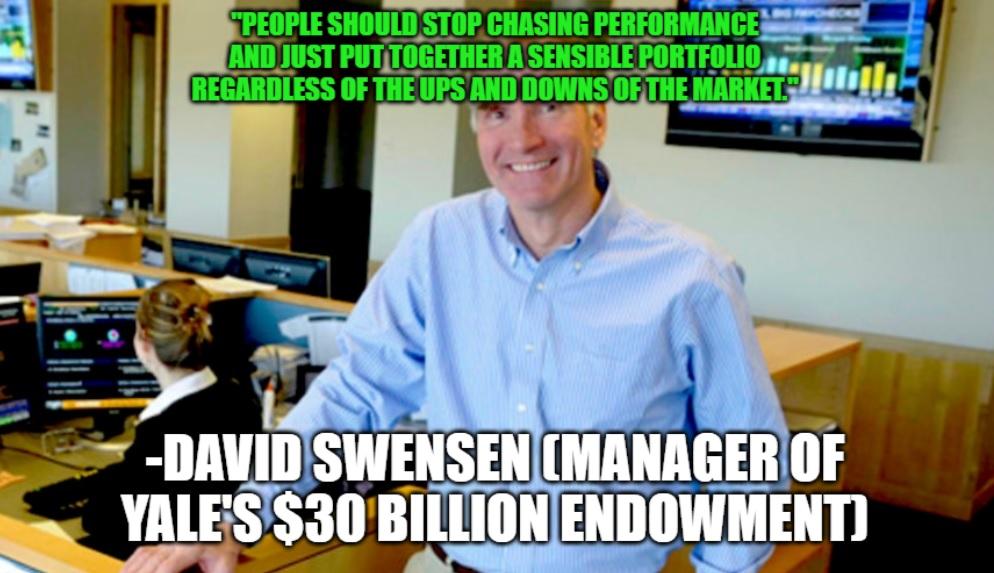
(Source: imgflip)
Your portfolio is like a business, literally a holding company consisting of equity stakes in other corporations as well as income-producing assets (bonds/cash equivalents).
Just as you wouldn’t think of shutting down a small business ahead of a recession you should avoid the siren song of market timing like the plague.
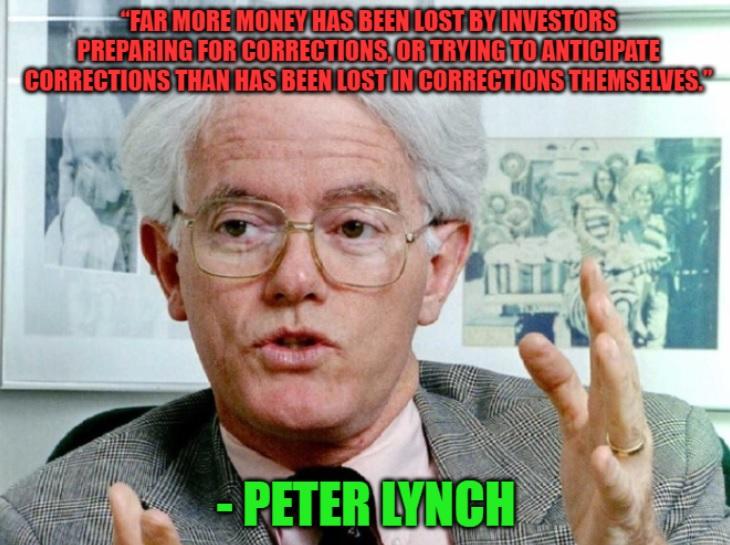
(Source: imgflip)
Trust your long-term plan, including your asset allocation and the quality of your companies to see you through whatever the future may bring. A future that, no matter what some pundit on TV might say, is never 100% certain, and thus must always be approached with a strategy that’s most likely to achieve your goals over time.
SPY shares were trading at $331.40 per share on Thursday afternoon, up $0.06 (+0.02%). Year-to-date, SPY has gained 2.96%, versus a % rise in the benchmark S&P 500 index during the same period.
About the Author: Adam Galas

Adam has spent years as a writer for The Motley Fool, Simply Safe Dividends, Seeking Alpha, and Dividend Sensei. His goal is to help people learn how to harness the power of dividend growth investing. Learn more about Adam’s background, along with links to his most recent articles. More...
More Resources for the Stocks in this Article
| Ticker | POWR Rating | Industry Rank | Rank in Industry |
| SPY | Get Rating | Get Rating | Get Rating |


