

The recent gyrations in the stock market have seen accompanying swings in market sentiment among both professionals and retail investors.
During the end of July, as stocks were making an orderly climb to new highs, following the Fed rate cut, most sentiment readings hit their most bullish levels of the year.
But, over the past two weeks, there has been a slew of negative developments and data points, from Trump’s threatened and then reversed new tariffs, growing negative interest rates and an inversion of the yield curve and weaker economic data, suggesting much of globe is heading to a recession, have all conspired to create uncertainty and concern about stock market.
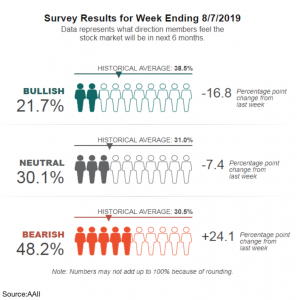
The American Association of Individual Investors sentiment index saw its largest bullish to bearish swing with the latter jumping over 24 percentage points to 49%; anything above 50 is usually considered extreme.
The reason so many people track sentiment indicators is they can be a useful tool for identifying market turning points. They are viewed as a contrarian indicator on the theory that people tend to become most or universally bullish and bearish at market highs and lows; at the bottom, everyone has already thrown in the towel, at the highs the feeling is nothing can go wrong.
But the key to making use of these signals is recognizing the readings need to reach what are considered and be aware they can remain extreme for a period of time.
Here are some examples of the current sentiment measures that have quickly turned bearish after this recent decline:
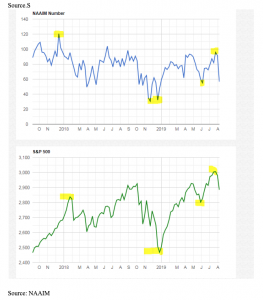
The National Association of Active Investment Managers or NAAIM Exposure Index which measures the average exposure to US equity markets by its members saw an extreme drop from 91.41 to 56.59. This is important as these are professionals managing large pools of money.
As you can see in the chart below, the highlighted areas when exposure hits extreme highs and lows that often marks the turning point in the market.
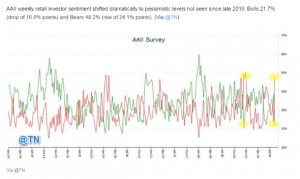
Here’s a different view of AAII sentiment index referenced above in which you can see the dramatic and rapid swing from bullish to bearish.
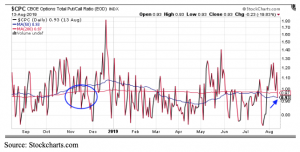
On the options front, we can see the put/call ratio is still far from extreme. What’s interesting to note is during last year’s market decline, which began in October, the reading stayed fairly subdued until a full-on panic in last December. The initial complacency through November was a sign the market had more downside ahead.
The CBOE volatility index has lifted but it’s far from extreme. Again, last fall you can see it too remained muted until the final washout bottom.
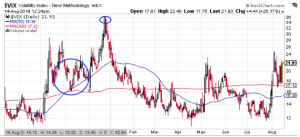
On the whole, the readings are still far from extreme suggesting there is more downside ahead.
SPY shares were trading at $285.09 per share on Wednesday afternoon, down $7.46 (-2.55%). Year-to-date, SPY has gained 15.13%, versus a % rise in the benchmark S&P 500 index during the same period.
About the Author: Option Sensei

Steve has more than 30 years of investment experience with an expertise in options trading. He’s written for TheStreet.com, Minyanville and currently for Option Sensei. Learn more about Steve’s background, along with links to his most recent articles. More...
More Resources for the Stocks in this Article
| Ticker | POWR Rating | Industry Rank | Rank in Industry |
| SPY | Get Rating | Get Rating | Get Rating |


