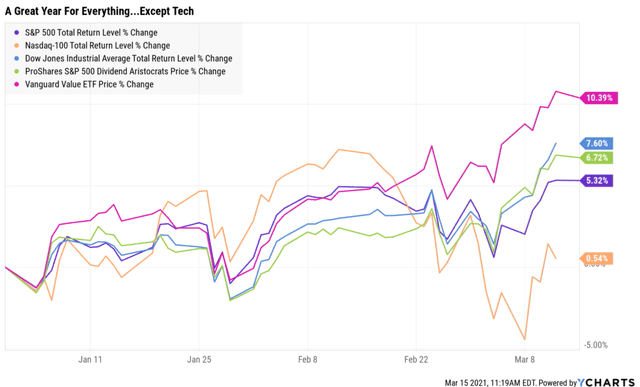
These days it seems everyone is making money except for tech investors.

The Nasdaq is flat for the year and fell into a 10% correction just a few days ago. A strong recovery in the last few days has many tech investors breathing a sigh of relief.
However, analysts at Ned Davis Research, and Societe Generale, are warning that the worst might not over for momentum investors.
Why Tech Stocks Might Crash 25%
Last week JPMorgan’s head of US equity strategy wanted that the recent rotation from growth to value may continue for some time.
This week that opinion got some backup from Ned David Research and Society Generale.
(Source: MarketWatch)
It should come as no surprise that when valuations get extreme, it doesn’t take much to pop the bubble and flip investor sentiment from greed to fear.
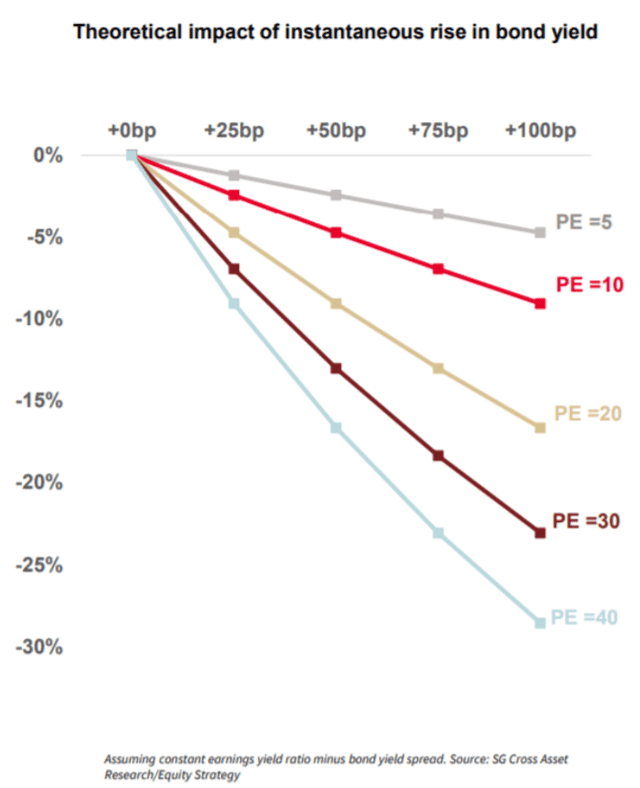
The Nasdaq’s PE ratio, depending on whether you’re using trailing or future estimates, and from what sources, ranged from 33 to 40 before the current correction began.
As you can see from Society General’s chart, a 1% increase in interest rates, particularly the 10-year yield, might trigger up to a 30% bear market if it happens very quickly.
- Nasdaq is down 5% from record highs now
- and could potentially fall 25% more
However, before you panic and run screaming from all things tech and growth, it’s important to keep two things in mind.
Why I’m Not Selling A Single Tech Share From My Portfolio
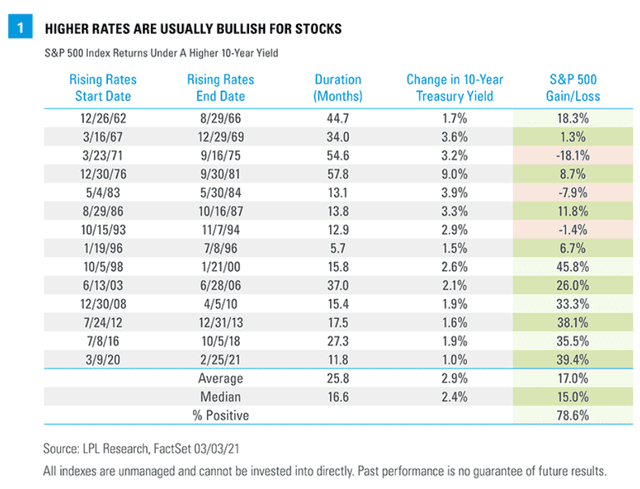
Here’s an interesting study from Lipper Financial, a subsidiary of Reuters’./
LPL Research looked at major extended periods of rising rates dating back to the early 1960s.
We found 13 periods in which the 10-year Treasury yield rose by at least 1.5%, a move the current increase hasn’t even reached yet.
These rising-rate periods lasted between six months and almost five years, with the average a little over two years.
In nearly 80% (10 of 13) of the prior periods, the S&P 500 Index posted gains as rates rose, as it has so far in the current rising-rate period.
In fact, the average yearly gain for the index during the previous rising-rate periods, at 6.4%, is just a little lower than the historical average over the entire period of 7.1%, while rising rates have been particularly bullish for stocks since the mid-1990s.
Not all rising-rate periods are the same, though, and we believe stocks may tolerate the current rising-rate period well.” – LPL

80% of the time 10-year yields are rising fast, stocks go up! Now, of course, we all know it’s a market of stocks and not a stock market.
The same day that can see one company fall 1% to 3% can see another soar by the same amount.
- according to JPMorgan, Bank of America, and Princeton, over 92% of short-term (less than 12 months) returns are a function of fickle sentiment
- basically, luck is 11X as powerful as fundamentals in the short-term
But doesn’t this mean that, if the Nasdaq were to collapse 25% simply due to soaring long-term rates and high valuations, that tech blue-chips like Amazon would be crushed?
Not necessarily. That’s because long-term interest rates are primarily set by bond markets based on inflation expectations.
From 1968 to 1990, the Consumer Price Index (CPI) rose an average of 6.2% per year and was above 3.5% every year except three.
Five of the rising rate periods took place at least partially during those inflationary years.
The average annual return during those rising-rate periods was -0.4%.
During all other rising-rate periods, the average annual return was 13.0%, well above the average for all returns since 1962. While inflation expectations are rising right now, CPI growth of even 2.5% at the end of the year would be an upside surprise based on the median estimate of Bloomberg-surveyed economists. For all the concerns about inflation, we are a long way from the ‘70s and ‘80s.” – Lipper Financial
Remember that the Soc Gen chart is based on an “instantaneous” increase in LT interest rates. Since the bond market doesn’t ever move that fast, the chances of the most extreme potential outcome are very slight.
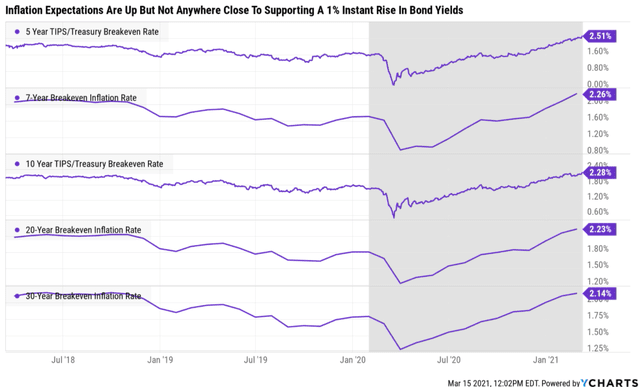
Especially, given that inflation expectations are nowhere near being that worrying.

The bond market is currently pricing in a modest elevation in inflation to 2.5% for the next five years.
- the Fed says a symmetrical target of 2% is the goal
- about 1.5% to 2.5% range is what various Fed presidents have hinted at
- beyond 5-years the bond market expects inflation to return very close to Fed’s long-term 2% target
What does this actually mean? That two to three rate hikes might be all the Fed needs to do to prevent inflation from getting above its goal.
In fact, in part 2 of this series, I’ll explain why rising interest rates are actually good for nearly all investors, even those owning falling names.
Want More Great Investing Ideas?
9 “MUST OWN” Growth Stocks for 2021
What Happens to Stocks AFTER Hitting 4,000?
5 WINNING Stocks Chart Patterns
SPY shares were trading at $396.54 per share on Thursday afternoon, down $0.72 (-0.18%). Year-to-date, SPY has gained 6.06%, versus a % rise in the benchmark S&P 500 index during the same period.
About the Author: Adam Galas

Adam has spent years as a writer for The Motley Fool, Simply Safe Dividends, Seeking Alpha, and Dividend Sensei. His goal is to help people learn how to harness the power of dividend growth investing. Learn more about Adam’s background, along with links to his most recent articles. More...
More Resources for the Stocks in this Article
| Ticker | POWR Rating | Industry Rank | Rank in Industry |
| SPY | Get Rating | Get Rating | Get Rating |


