
After a sensational 2019, in which the S&P 500 surged an astonishing 31.5% (the second-best year in two decades) 2020 has turned into a bit of a horror show.
 During periods of intense market fear, and outright panic, as we’re seeing now, no sector is spared the pain.
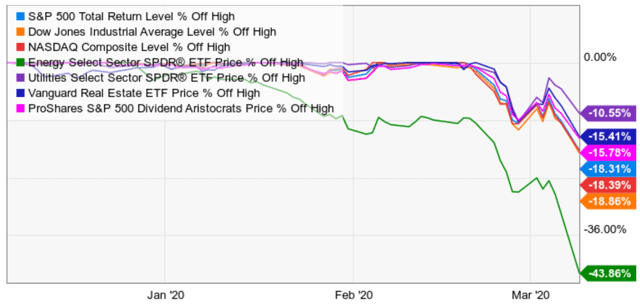
(Source: Ycharts)
You might have expected energy to do terribly in a correction that’s all about recession fears. But would you have expected utilities, the so-called “bond alternative”, recession-resistant and low volatility sector to still fall into a correction?
Mind you utilities are acting defensively, but falling about half as much as the broader market. As I write this, utilities are down 5.5%, which is barely better than the broader market’s frightening 8% decline. Even the famous dividend aristocrats are down 16%, illustrating why no stock is ever a true bond alternative.
But I digress, let’s get to the heart of the matter in this series, which is why did the market choose this week to fall off a cliff?
Worst Day For Oil in 30 Years Sends Recession Fears Soaring
Last Friday Russia and Saudi Arabia concluded their latest meeting without a deal. Through April 1st a 2.1 million bpd production cut is in effect. Saudi Arabia was hoping to extend this through the end of the year plus add another 1.5 million bpd to the cut.
China’s oil demand, as of last month, was down about 20%, or 3 million bpd. That’s a staggering amount and sets up 2020 to be the first year in which global oil demand declines in modern history.
Russia balked at the prospect because it believes that a 1.5 million bpd cut wouldn’t make much of a difference.
It also wanted to hurt US shale producers which Russia believes have been getting a free ride.
Saudi Arabia shocked the world when on Saturday, it declared an outright price war with Russia. It slashed the price of its oil, announced it would increase production by over 1 million bpd, potentially flooding the global market at the same time Russia is planning to increase its production and global demand is falling.
But the end-game here is not low oil prices, but rather forcing Russia back to the negotiating table. The question is how long – if at all – that will take. “We would stress that it is not in any OPEC+ nations’ interest to have sustained oil prices below US$50, and hence we see this solely as a strategic move from the Saudis,” RBC says.” – Seeking Alpha (emphasis added)
Saudi Arabia isn’t actually trying to nuke US shale (like Russia is) but rather force Russia back into the so-called OPEC+ alliance.
However, the short-term effect is that the global oil glut will get worse and so on Sunday night oil futures opened down 31% at the open. They are still down 25% as I write this to about $32.
For context, the January 2016 low was $26, and that too was during a period of high recessionary fear. Before the single worst daily crash in 30 years, Morgan Stanley had been forecasting that crude MIGHT fall as low as $32 because of a possible COVID-19 global recession.
Saudi Arabia just sent oil to that level overnight.
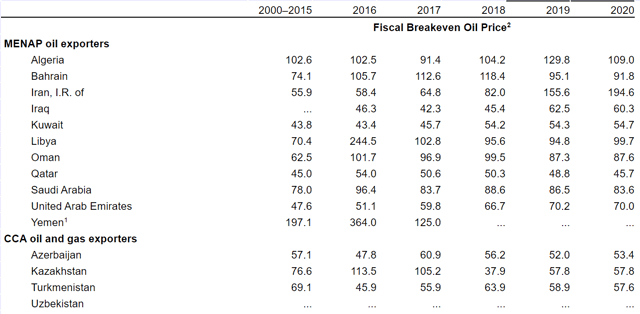
(Source: IMF)
The good news about this historic oil crash is that Saudi Arabia needs about $87 oil prices to balance its budget.
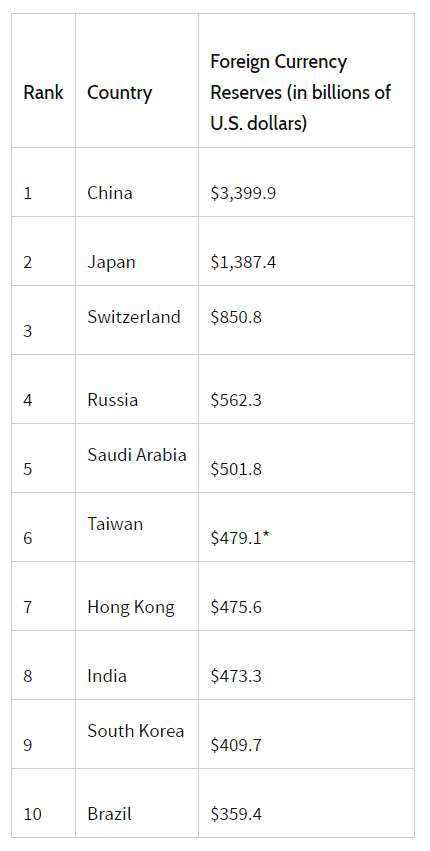
(Source: Investopedia) data as of January 2020
It began 2014 with nearly $800 billion in currency reserves but is now down to $500 billion, less than Russia has. Russia requires just $42 crude to balance its budget which is a likely reason why it didn’t agree to Saudi Arabia’s deal on Friday.
Ok, so that explains why some oil stocks fell as much as 50% on Monday. But why did the market freak out and fall as much as 8%? After all, energy is just 4% of the S&P 500, so this shouldn’t be that big a deal right?
What has Wall Street worried is the potential for high loan defaults from distressed energy companies to create a sort of mini-financial crisis.
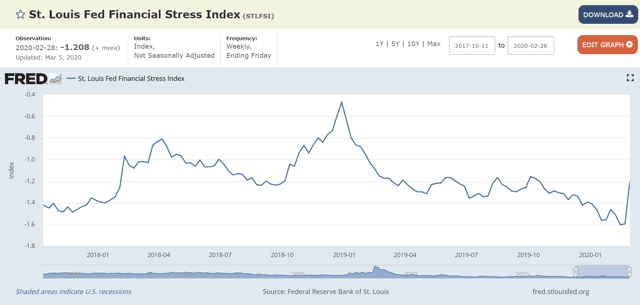
Already the correction had spooked the financial markets causing financial stress to spike in the past week. 0 = the average since 1993 and +1 is generally financial stress associated with recessions.
This index is only updated once per week (it consists of 17 different indexes). But looking at corporate bond yields clearly shows how worried Wall Street is about short-term energy bankruptcies.
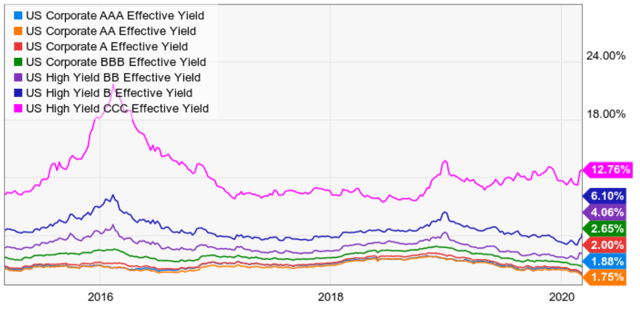
(Source: Ycharts)
Investment-grade bonds, meaning BBB or higher, have seen their yields fall along with US treasury yields. Junk bonds, meaning BB or lower, have seen a sharp spike in what bond investors are demanding to buy them.
Is it actually likely that the oil crash will trigger a financial crisis that snowballs into anything like 2008-2009? Highly unlikely. The 2014-2016 oil crash saw oil fall to $26, and back then energy companies had significantly higher leverage and break-even costs.
However, is it true that some poorly run oil companies, that foolishly took on a lot of debt to fund production growth rather than focusing on maximizing cash flow might go bankrupt? It’s certain some will.
Is that likely to be enough to cause a recession? Not likely. Could it potentially make an existing recession worse? You bet.
So that’s why the market chose this week to cliff dive so severely.
Now here’s what you can do about it.
The Best And Worst Things Investors Can Do Right Now
Fear is not an investment strategy and, more importantly, panic is not an investment strategy,” Brian Belski, chief investment strategist at BMO Capital Markets, told CNN Business’ Richard Quest. “We still think that US stocks are in a 20-year bull market.” – CNBC (emphasis added)
The biggest mistake investors make during a market panic is thinking like gamblers rather than business people.
If you own a restaurant on a beach and the weather forecast shows a hurricane approaching, are you going to rush to sell the restaurant before the hurricane hits? Are you going to lower the selling price because you know the hurricane is going to hit and you are going to lose a few days or possibly weeks of business? Of course not! So why would you do the same with stocks?
Intrinsic value has nothing to do with what the market is looking at. Intrinsic value is a mathematical truth as long as the inputs are correct (or reasonable enough). Intrinsic value is 100% independent of Mr. Market’s opinion. ” – Brooklyn investor (emphasis added
The nature of a well-run business is that you make the best decisions you can for your long-term goals using the most reliable data you have.
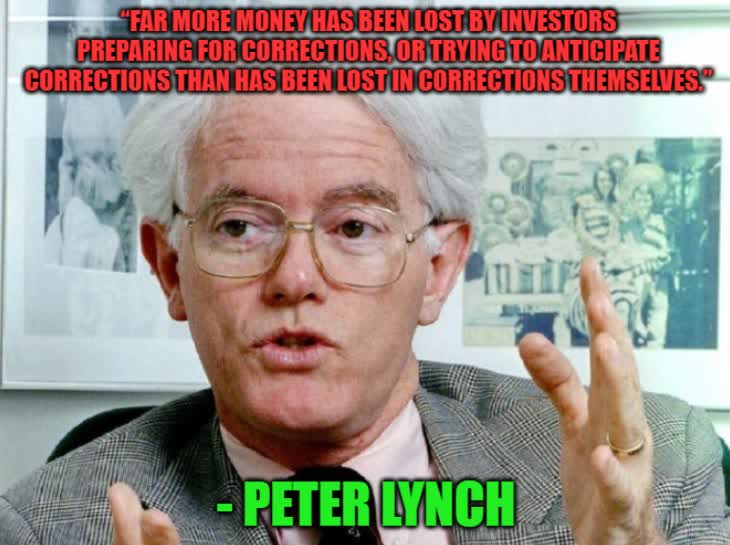
(Source: imgflip)
What do I mean?
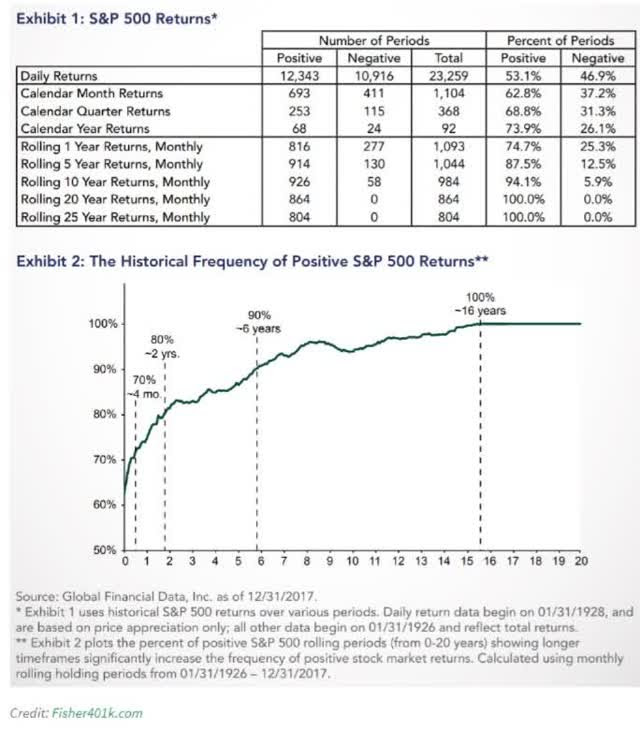
The stock market regardless of valuation (currently about fairly valued) goes up 70% of the time in any 3 month period and 75% of all years. By two years, the market is up 80% of the time and by 16 years, the probability of making money is virtually 100%.
In other words, for those with savings to put to work for 5+ years, there is no higher probability choice than investing in stocks.
Savita Subramanian, Bank of America’s head quant, had this to say about the current correction.
The firm said that a correction has occurred once a year on average since 1928, and that losses are typically recovered over the subsequent three months.
Additionally, the strategists don’t see a bear market on the horizon. Currently 53% of the firm’s bear market signposts are triggered. The list includes factors like consumer confidence and monetary policy. Since 1960, more than 80% have been triggered ahead of prior market peaks.” – CNBC
In contrast here is what market timing gets you.
Looking at data going back to 1930, Bank of America found that if an investor missed the S&P 500′s 10 best days in each decade, total returns would be just 91%, significantly below the 14,962% return for investors who held steady through the downturns.
The firm noted this eye-popping stat while urging investors to “avoid panic selling,” pointing out that the “best days generally follow the worst days for stocks.” -CNBC
99.4% of the market’s total returns over the past 90 years have come from just 270 of its best single days. The same days that cluster around periods of panic like we’re seeing now.
In 2018, when the broader market finished down 4.4%, Dalbar reports the average retail investor lost more than twice as much, 9.4%. This is what happens if you attempt to time the market via panic selling.
Don’t believe BAC? Then how about JPMorgan and Morningstar.
(Source: Morningstar)
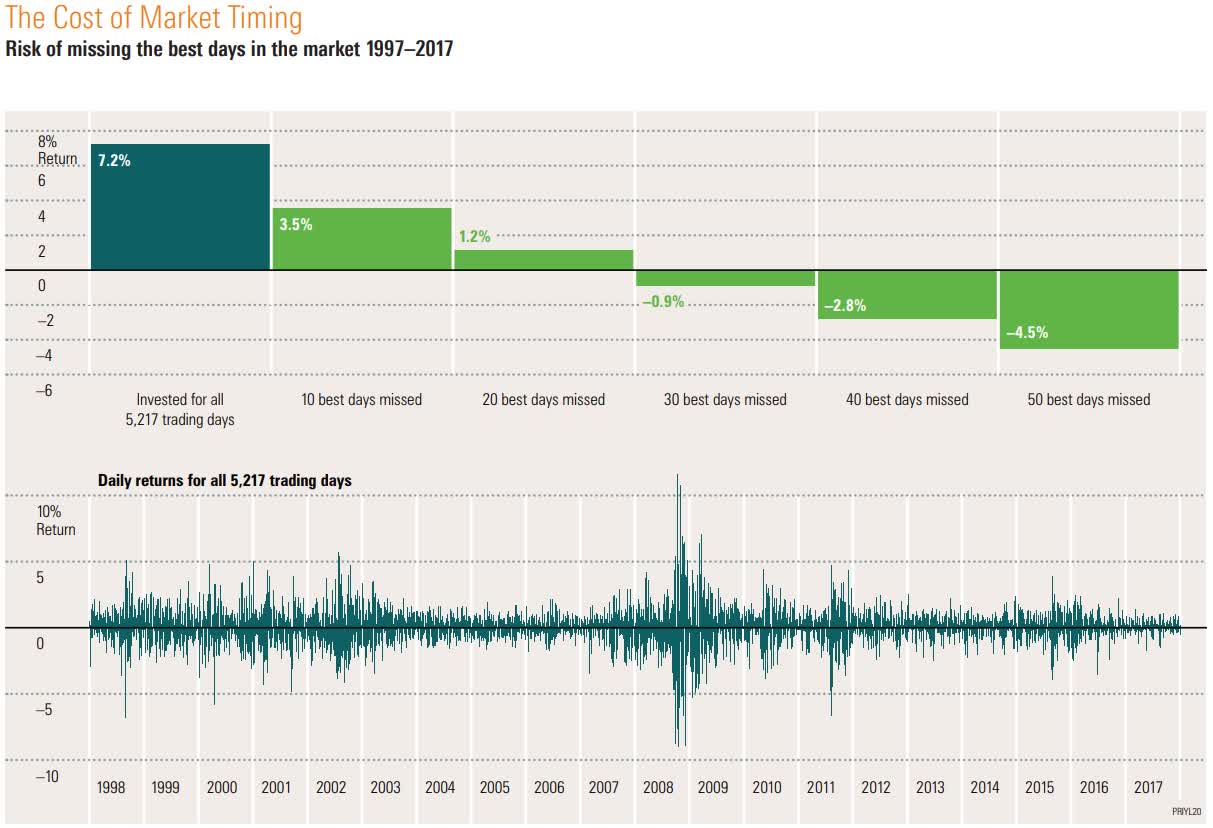
Miss just 0.1% of the market’s best days from 1997 to 2017 and rather than earn 302% total returns from stocks, you’d have seen a 60% decline in your portfolio over half an investing lifetime.
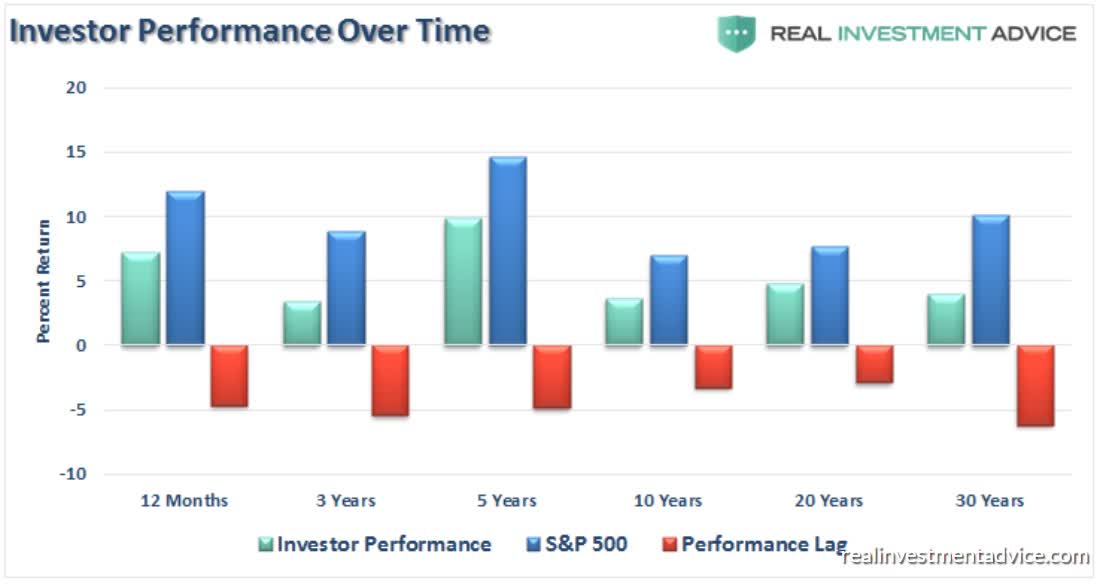
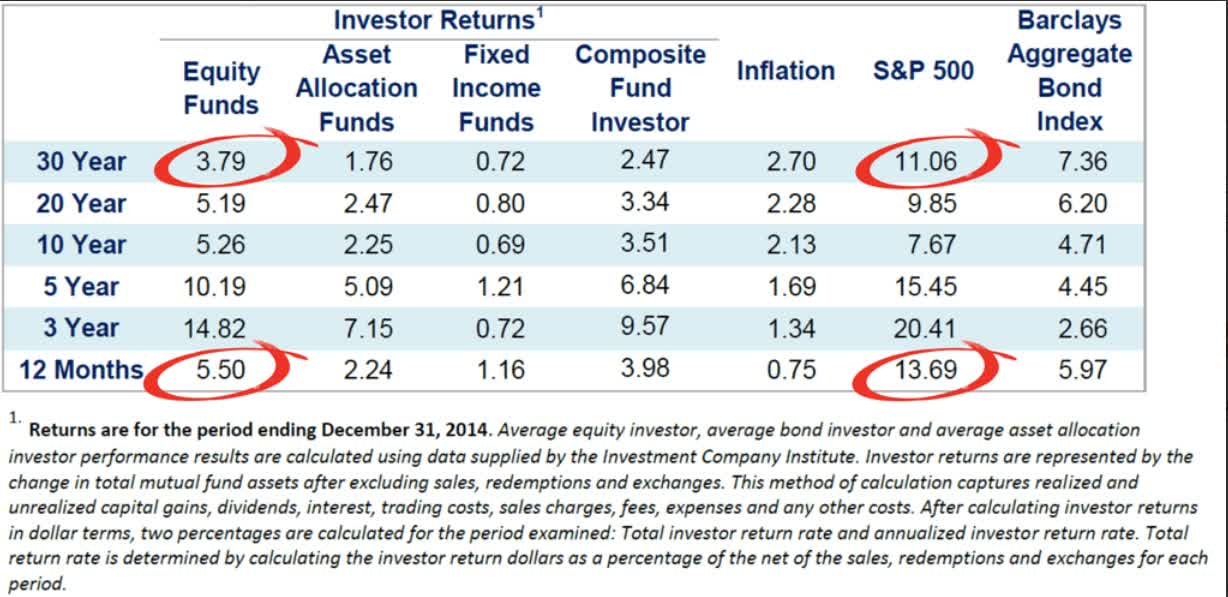
Given that most investors can’t help themselves from buying high and selling low, is it any surprise that over the past 30 years both stock and bond investors have done so poorly?
(Source: Dalbar)
Am I saying that the market is going to surge higher from here, ala 2019’s incredible rally? Not necessarily.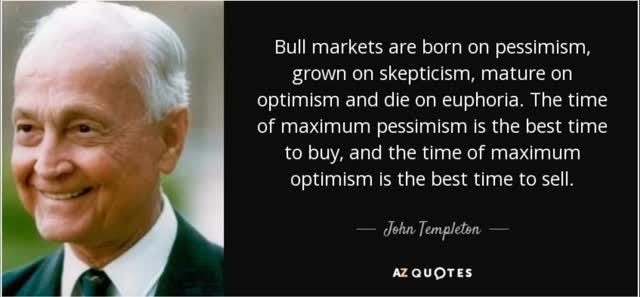
However, don’t forget that sentiment is often a good contrarian indicator as John Templeton reminds us.

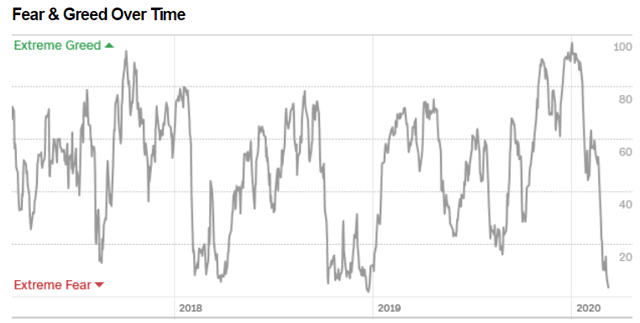
(Source: CNN)
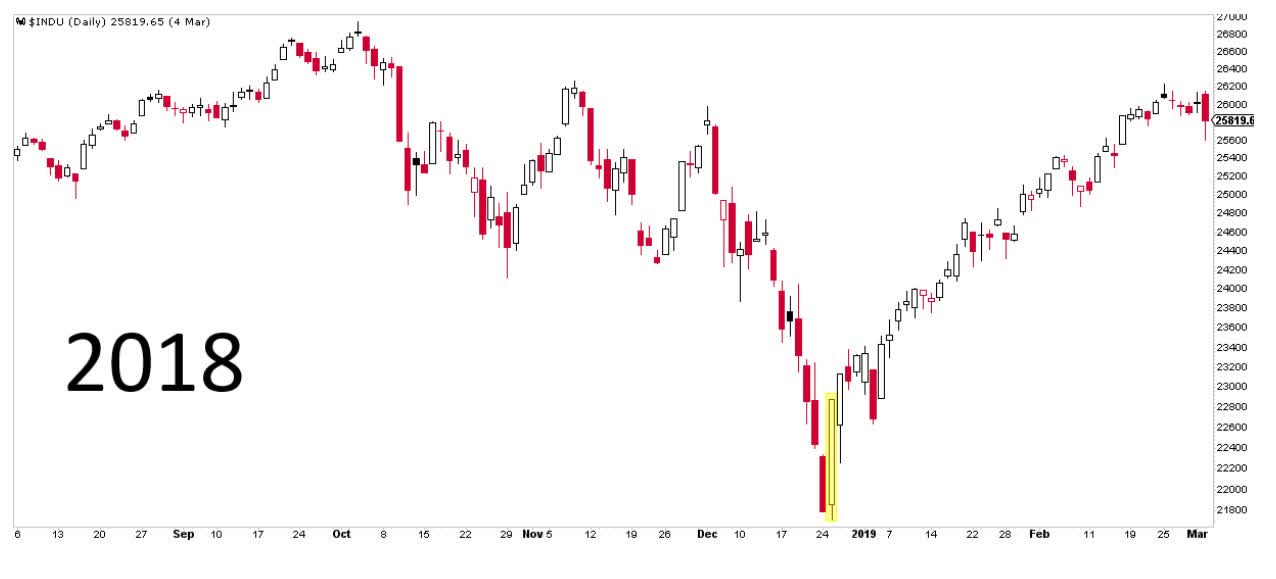
In the December 2018 crash, in which stocks fell 17% in three weeks, the CNN fear and greed index bottomed at two. It’s now at three.
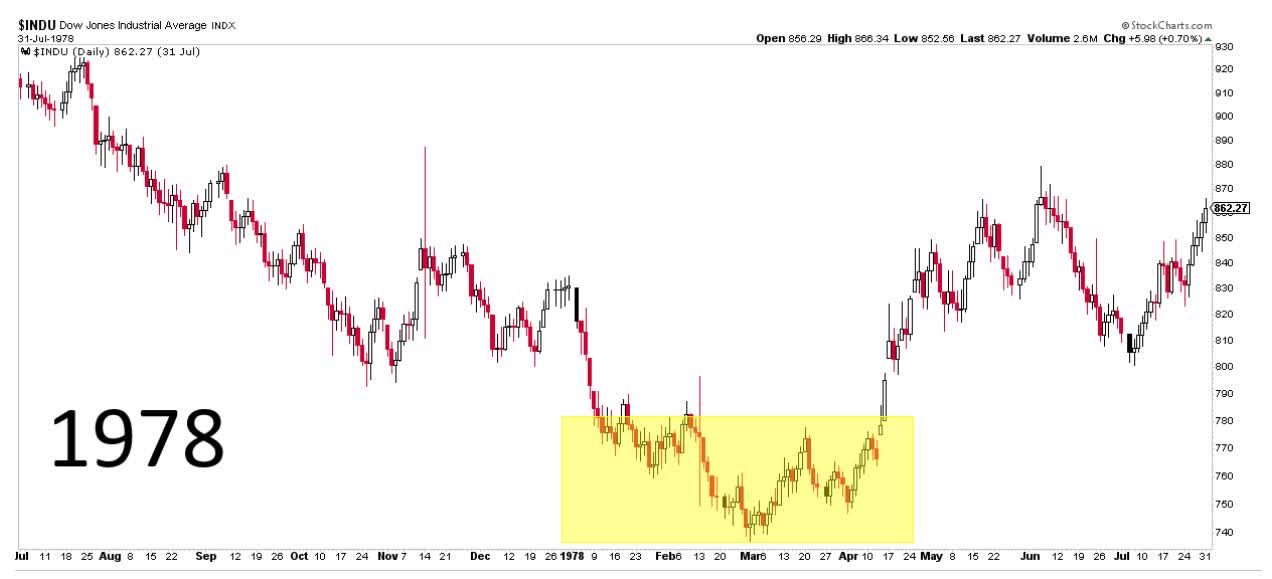
Now it’s certainly true that every downturn is different.
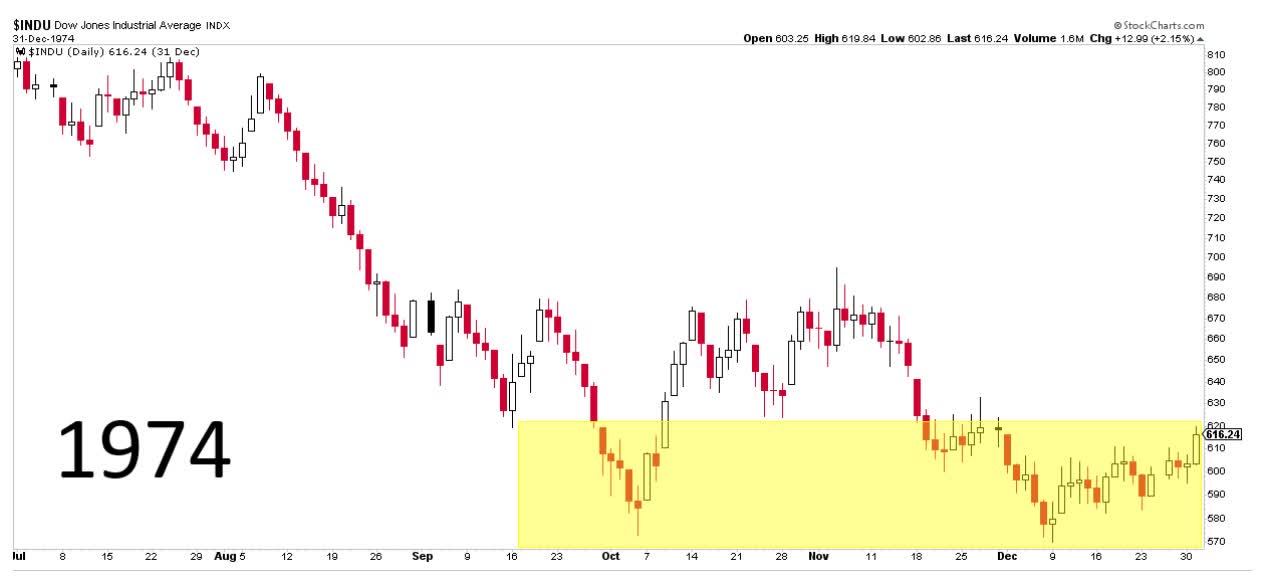
(Source: Michael Batnick)
Historically speaking the average correction since 1945 takes four months for stocks to bottom followed by a four-month recovery to record highs.
The nature of statistics is that such historical data is only a rough guide of what might happen, not a guarantee of what will.
However, could stocks bottom by mid-May? If the COVID-19 epidemic has peaked by then and the next two months of economic data come in above the currently very pessimistic levels? Then yes, we might indeed see the market stage a nice mid-year rally.
So with all this uncertainty what’s a reasonable and prudent investor to do?
- stay calm, rational and stick to your long-term plan
- trust your risk-management plan, NOT market timing, to protect your nest egg
- buy opportunistically if you have the buying power
- ignore the market entirely if you don’t
- make sure your opportunistic buying matches the probabilistic nature of the market itself
Personally, the 7% crash at the open on Monday tapped out the last of my buying power. It will take about a month or so to get more.

(Source: AZ Quotes)
But I have no regrets because I managed to lock in some truly spectacular deals such as Broadcom at a 5.2% yield and 10.9 PE. In fact, I bought AVGO four times on Monday, increasing my position size by about 33%.
For someone who savors being “greedy when others are fearful”, I take great satisfaction in tapping out my buying power on the 17th worst day for stocks in history.
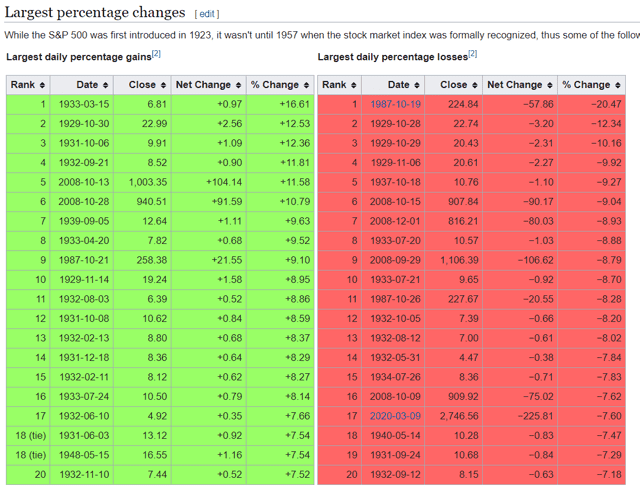
(Source: Wikipedia)
SPY shares were trading at $278.99 per share on Wednesday morning, down $9.43 (-3.27%). Year-to-date, SPY has declined -13.32%, versus a % rise in the benchmark S&P 500 index during the same period.
About the Author: Adam Galas

Adam has spent years as a writer for The Motley Fool, Simply Safe Dividends, Seeking Alpha, and Dividend Sensei. His goal is to help people learn how to harness the power of dividend growth investing. Learn more about Adam’s background, along with links to his most recent articles. More...
More Resources for the Stocks in this Article
| Ticker | POWR Rating | Industry Rank | Rank in Industry |
| SPY | Get Rating | Get Rating | Get Rating |


