Broadcom Inc. (AVGO): Price and Financial Metrics
AVGO Price/Volume Stats
Current price | $812.00 | 52-week high | $921.78 |
Prev. close | $789.95 | 52-week low | $415.07 |
Day low | $787.20 | Volume | 6,281,400 |
Day high | $823.77 | Avg. volume | 2,460,957 |
50-day MA | $653.56 | Dividend yield | 2.29% |
200-day MA | $566.26 | Market Cap | 338.54B |
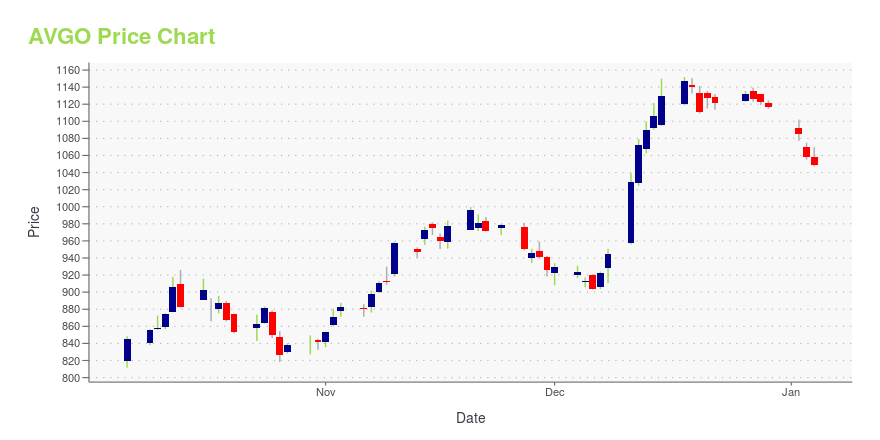
AVGO Stock Price Chart Interactive Chart >
AVGO POWR Grades
- Quality is the dimension where AVGO ranks best; there it ranks ahead of 97.48% of US stocks.
- The strongest trend for AVGO is in Stability, which has been heading up over the past 179 days.
- AVGO's current lowest rank is in the Value metric (where it is better than 37.75% of US stocks).
AVGO Stock Summary
- AVGO has a market capitalization of $283,312,137,398 -- more than approximately 99.52% of US stocks.
- Of note is the ratio of BROADCOM INC's sales and general administrative expense to its total operating expenses; just 7.02% of US stocks have a lower such ratio.
- With a price/sales ratio of 8.23, BROADCOM INC has a higher such ratio than 87.03% of stocks in our set.
- Stocks that are quantitatively similar to AVGO, based on their financial statements, market capitalization, and price volatility, are MRK, ASML, ORCL, PFE, and AMD.
- AVGO's SEC filings can be seen here. And to visit BROADCOM INC's official web site, go to www.broadcom.com.
AVGO Valuation Summary
- AVGO's price/earnings ratio is 22.4; this is 15.95% lower than that of the median Technology stock.
- AVGO's price/sales ratio has moved up 5.8 over the prior 168 months.
Below are key valuation metrics over time for AVGO.
Stock | Date | P/S | P/B | P/E | EV/EBIT |
---|---|---|---|---|---|
AVGO | 2023-05-22 | 8.2 | 12.1 | 22.4 | 20.2 |
AVGO | 2023-05-19 | 8.3 | 12.2 | 22.6 | 20.3 |
AVGO | 2023-05-18 | 8.2 | 12.1 | 22.4 | 20.2 |
AVGO | 2023-05-17 | 8.0 | 11.8 | 21.8 | 19.6 |
AVGO | 2023-05-16 | 7.8 | 11.5 | 21.2 | 19.2 |
AVGO | 2023-05-15 | 7.8 | 11.4 | 21.2 | 19.1 |
AVGO Growth Metrics
- Its year over year net cashflow from operations growth rate is now at 10%.
- Its 4 year revenue growth rate is now at 45.22%.
- Its 3 year revenue growth rate is now at 33.74%.

The table below shows AVGO's growth in key financial areas (numbers in millions of US dollars).
Date | Revenue | Operating Cash Flow | Net Income to Common Stock |
---|---|---|---|
2022-12-31 | 33,203 | 16,736 | 11,223 |
2022-09-30 | 31,680 | 15,694 | 9,826 |
2022-06-30 | 29,994 | 14,811 | 8,629 |
2022-03-31 | 28,501 | 14,137 | 7,531 |
2021-12-31 | 27,450 | 13,764 | 6,437 |
2021-09-30 | 26,510 | 13,571 | 5,773 |
AVGO's Quality Factors
The “Quality” component of the POWR Ratings focuses on 31 different factors of a companies fundamentals and operational strength. Here are some key insights as we drill into the specifics of these quality attributes.- AVGO has a Quality Grade of B, ranking ahead of 89.54% of graded US stocks.
- AVGO's asset turnover comes in at 0.348 -- ranking 166th of 208 Electronic Equipment stocks.
- ON, MU, and DZSI are the stocks whose asset turnover ratios are most correlated with AVGO.
The table below shows AVGO's key quality metrics over time.
Period | Asset Turnover | Gross Margin | ROIC |
---|---|---|---|
2021-08-01 | 0.348 | 0.602 | 0.177 |
2021-05-02 | 0.332 | 0.590 | 0.149 |
2021-01-31 | 0.315 | 0.575 | 0.121 |
2020-11-01 | 0.301 | 0.566 | 0.092 |
2020-08-02 | 0.300 | 0.557 | 0.086 |
2020-05-03 | 0.305 | 0.552 | 0.087 |
AVGO Price Target
For more insight on analysts targets of AVGO, see our AVGO price target page. And for a list of of all stocks sorted by upside potential based on analyst target price, see our Top Price Target page.
Average Price Target | $553.73 | Average Broker Recommendation | 1.47 (Moderate Buy) |
Broadcom Inc. (AVGO) Company Bio
Broadcom Limited designs, develops and supplies a broad range of analog and digital semiconductor connectivity solutions, including wired infrastructure, wireless communications, enterprise storage and industrial & others. The Company's products are used in data center networking, home connectivity, broadband access, telecommunications equipment, smartphones and base stations.
Latest AVGO News From Around the Web
Below are the latest news stories about BROADCOM INC that investors may wish to consider to help them evaluate AVGO as an investment opportunity.
AVGO Stock Alert: Apple Strikes a HUGE 5G Deal With BroadcomWith Broadcom and Apple securing a deal for 5G RF components, the symbiotic nature of the agreement bolsters AVGO stock. |
Broadcom Inc. (AVGO) Stock Sinks As Market Gains: What You Should KnowBroadcom Inc. (AVGO) closed at $678.37 in the latest trading session, marking a -0.57% move from the prior day. |
The Smartest Dividend Stocks to Buy With $400 Right NowAs a class, dividend growth stocks consistently outperformed all other classes of stocks over decades-long periods. One reason for this is that dividend-paying companies tend to be more disciplined with acquisitions and investments because management teams know that breaking their dividend commitment to shareholders generally has very negative consequences. Here are two stocks that have both crushed the S&P 500 index in the past 10 years. |
VMware Extends Deadline for Takeover by Broadcom in Face of Scrutiny(Bloomberg) -- VMware Inc. has agreed to extend the deadline for its takeover by Broadcom Inc. as the $61 billion deal faces regulatory scrutiny. Most Read from BloombergChina’s $23 Trillion Local Debt Mess Is About to Get WorseMexico Raises Alert Level on Volcano Rumbling Near CapitalMeta Fined Record €1.2 Billion in EU Over US Data TransfersMessi, Ronaldo Lead Saudi Arabia's Multibillion-Dollar MakeoverThe companies are now aiming to complete the purchase by Aug. 26, a three-month postponement |
Chip Giant Embraces AI And Its Inner 'Zen' To Ignite New Buy ZoneJoining Nvidia and Broadcom in the ranks of top-rated chip designers, AMD stock taps AI and its inner Zen to power a new breakout. |
AVGO Price Returns
1-mo | 32.42% |
3-mo | 29.25% |
6-mo | 52.49% |
1-year | 45.38% |
3-year | 199.85% |
5-year | 277.36% |
YTD | 46.27% |
2022 | -13.27% |
2021 | 56.48% |
2020 | 44.88% |
2019 | 29.05% |
2018 | 2.18% |
AVGO Dividends
Ex-Dividend Date | Type | Payout Amount | Change | ||||||
---|---|---|---|---|---|---|---|---|---|
Loading, please wait... |
Continue Researching AVGO
Want to do more research on Broadcom Inc's stock and its price? Try the links below:Broadcom Inc (AVGO) Stock Price | Nasdaq
Broadcom Inc (AVGO) Stock Quote, History and News - Yahoo Finance
Broadcom Inc (AVGO) Stock Price and Basic Information | MarketWatch
Loading social stream, please wait...