

- The market expected a 51 bcf injection into storage for the week ending on October 9
- Natural gas rallies after Hurricane Delta hits the same region as Hurricane Laura
- The price of natural gas rises above the November 2019 high, but stockpiles continue to tell us that a sustained rally above $3 per MMBtu is in jeopardy as we enter the peak season for demand
Over the past week, the natural gas price rose to a new high at $2.955 per MMBtu. The energy commodity surpassed the November 2019 high of $2.905 and reached the highest price since January 2019. The twenty-one month high came only four months after the price fell to its lowest level in a quarter of a century. In late June, natural gas traded to a low of $1.432 per MMBtu.
Natural gas (UNG) can be one of the most volatile commodities that trade on the futures exchange. The price has traded from a low of $1.02 to a high of $15.65 per MMBtu over the past three decades. Natural gas can halve or double in price over short periods, as we witnessed since June. We are now heading into the peak season for demand in the natural gas market at a time when the US election will determine the future of energy policy. Fracking to extract natural gas from the earth’s crust in the United States is a hot button issue in the election. Bullish and bearish factors are pulling the natural gas market in opposite directions, which sent the price to a twenty-five-year low in June and pushed it to a twenty-one-month high this week. On the bearish side of the argument is the level of inventories in storage across the US. The Energy Information Administration reported its weekly stockpile data on Thursday, October 15, for the week ending on October 9. The United States Natural Gas Fund (UNG) moves higher and lower with the price of the NYMEX natural gas futures market. The price action has been very volatile in the natural gas arena.
The market expected a 51 bcf injection into storage for the week ending on October 9
According to Estimize, a crowdsourcing website, the market expected that natural gas inventories would rise by 51 billion cubic feet for the week ending on October 9.
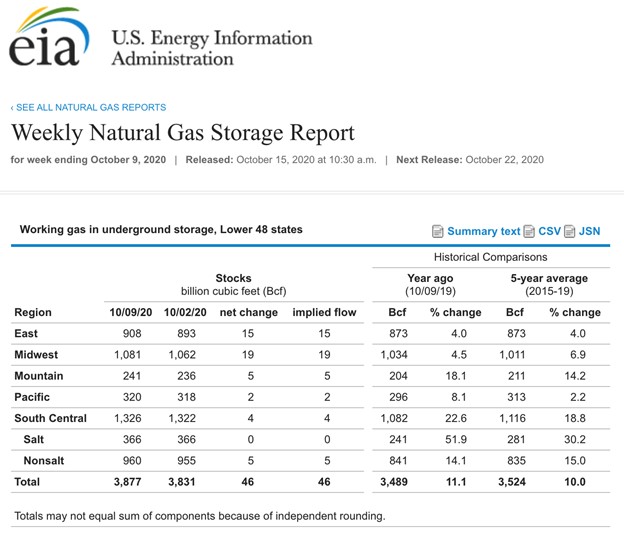
Source: EIA
As the chart illustrates, the Energy Information Administration reported that the amount of natural gas in storage across the United States rose by 46 billion cubic feet for the week ending last Friday. Total stockpiles stood at 3.877 trillion cubic feet, 11.1% above last year’s level, and 10% over the five-year average. It was the twenty-eighth consecutive week where the percentage above the previous week declined.
Natural gas rallies after Hurricane Delta hits the same region as Hurricane Laura
The daily trading ranges in the natural gas futures market have expanded over the past weeks. Hurricane Delta hit the same region as Hurricane Laura a month earlier. The Gulf Coast of the US is home to natural gas infrastructure. The delivery point for NYMEX futures is in Erath, Louisiana, not far from the Coast.
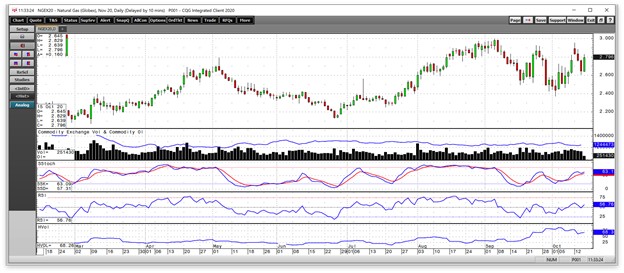
Source: CQG
As the daily chart of natural gas futures highlights, the price reached a high of $3.002 per MMBtu during Hurricane Laura on September 4, fell to a low of $2.373 on October 2, and then rose to $2.955 on October 12 on the back of Hurricane Delta. Daily historical volatility reached a peak of almost 90% earlier this month and was at over 68% on October 15. Wide daily trading ranges are keeping the price variance metric at an elevated level. Both price momentum and relative strength indicators were above neutral readings after the latest EIA inventory data, with the price around the $2.80 level.
Meanwhile, the total number of open long and short positions has moved lower from 1.286 million contracts on October 5 to 1.244 million as of October 14.
The price of natural gas rises above the November 2019 high, but stockpiles continue to tell us that a sustained rally above $3 per MMBtu is in jeopardy as we enter the peak season for demand
On October 12, natural gas surpassed the November 2019 high at $2.905 per MMBtu.
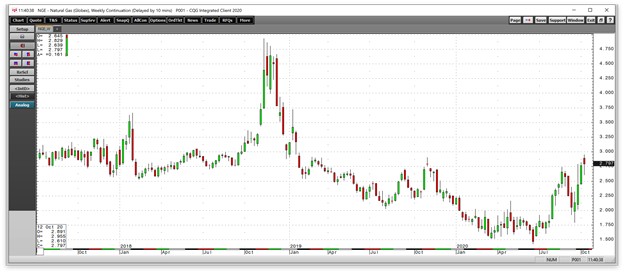
Source: CQG
As the weekly chart shows, the continuous contract price moved to its highest level since January 2019 this week. We are coming into the peak season for demand over the coming weeks. The US election will determine the future of energy regulation for the world’s leading producer of the energy commodity. However, the level of inventories is approaching the four trillion cubic feet level for only the third time since the EIA began reporting data.
With approximately five weeks to go until the start of the withdrawal season, an average injection of over 34 bcf would push inventories to a new record high above 4.047 tcf going into the 2020/2021 peak season. While natural gas’s volatility in the futures market makes anything possible, the supply side of the fundamental equation could make a sustained move above $3 per MMBtu a challenge. The stockpile level reflects enough natural gas to meet all requirements, even if the average temperatures are below normal for the coming months.
Want More Great Investing Ideas?
2020 Stock Market Bubble Part 2?
7 Best ETFs for the NEXT Bull Market
5 WINNING Stocks Chart Patterns
UNG shares were trading at $12.37 per share on Thursday afternoon, up $0.58 (+4.92%). Year-to-date, UNG has declined -26.63%, versus a 9.33% rise in the benchmark S&P 500 index during the same period.
About the Author: Andrew Hecht

Andy spent nearly 35 years on Wall Street and is a sought-after commodity and futures trader, an options expert and analyst. In addition to working with StockNews, he is a top ranked author on Seeking Alpha. Learn more about Andy’s background, along with links to his most recent articles. More...
More Resources for the Stocks in this Article
| Ticker | POWR Rating | Industry Rank | Rank in Industry |
| UNG | Get Rating | Get Rating | Get Rating |


