

- Two very similar products
- VDE is less expensive to trade, and it delivered better performance since March
- VDE could have more flexibility because of its net asset base
Since early March, when OPEC and Russia decided to flood the world with crude oil at a time when the spread of COVID-19 was destroying demand, the price of crude oil has been moving like a psychotic horse charging through a burning barn. From mid-February until April 20, the price of nearby NYMEX crude oil futures dropped from $54.50 per barrel to negative $40.32, a trading range of $94.82. The last time the energy commodity traded in that kind of a range was, never.
Shares of crude oil-related stocks were a harbinger of the bearish price action in the energy commodity. They signaled problems in the oil patch when they spent half of 2018, all of 2019, and the early months of 2020 underperforming both the price of crude oil and the overall stock market.
The Energy Select Sector SPDR Fund (XLE - Get Rating) and the Vanguard Energy Index Fund ETF Shares (VDE - Get Rating) have similar holdings. Meanwhile, the VDE product may be a better choice for investors and traders for several reasons.
Two very similar products
The top holdings of the XLE include:
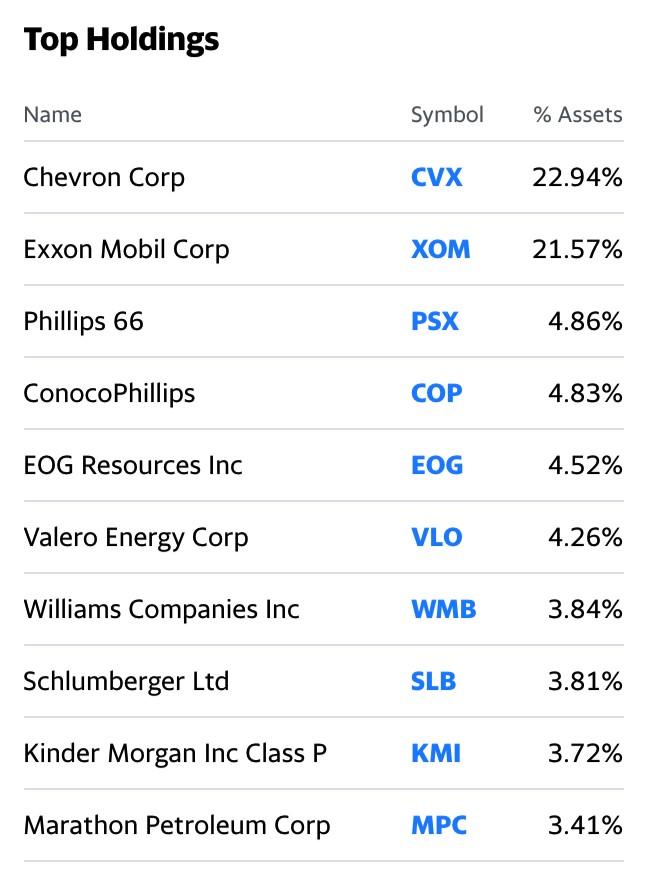
(Source: Yahoo Finance)
The XLE had a 44.51% exposure to Chevron (CVX) and Exxon Mobile (XOM) as of the end of last week. The XLE had net assets of $9.97 billion and trades an average of over 38.9 million shares each day.
The top holdings of VDE include:
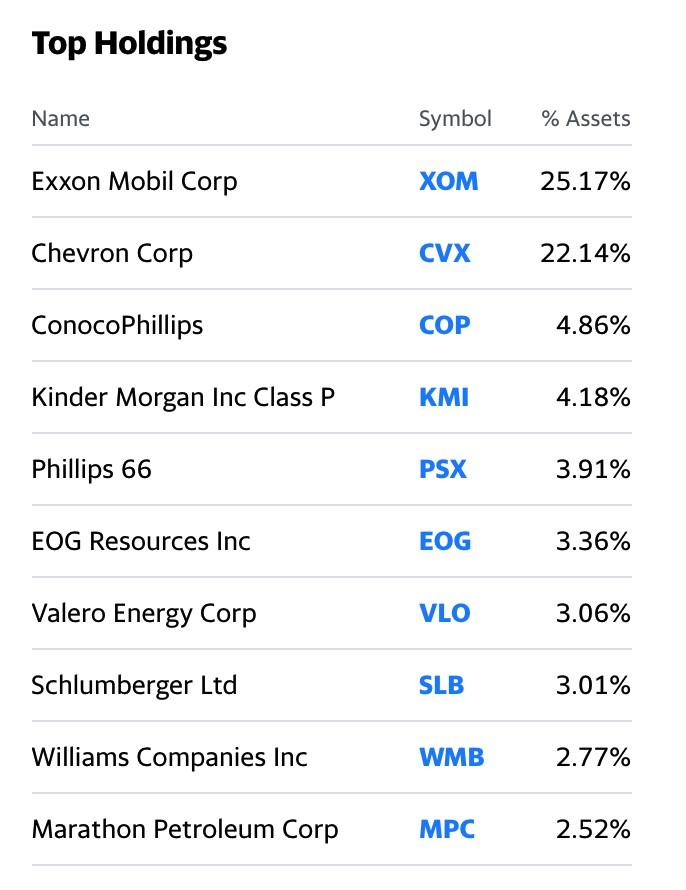
(Source: Yahoo Finance)
VDE had a slightly higher 47.31% exposure to XOM and CVX, with net assets of $3.43 billion, and an average of 1.945 million shares changing hands on average each day.
VDE is less expensive to trade, and it delivered better performance since March
VDE charges an expense ratio of ten basis points, while XLE charges holders thirteen basis points. The VDE is cheaper for investors, and its performance has been better since the lows in March.
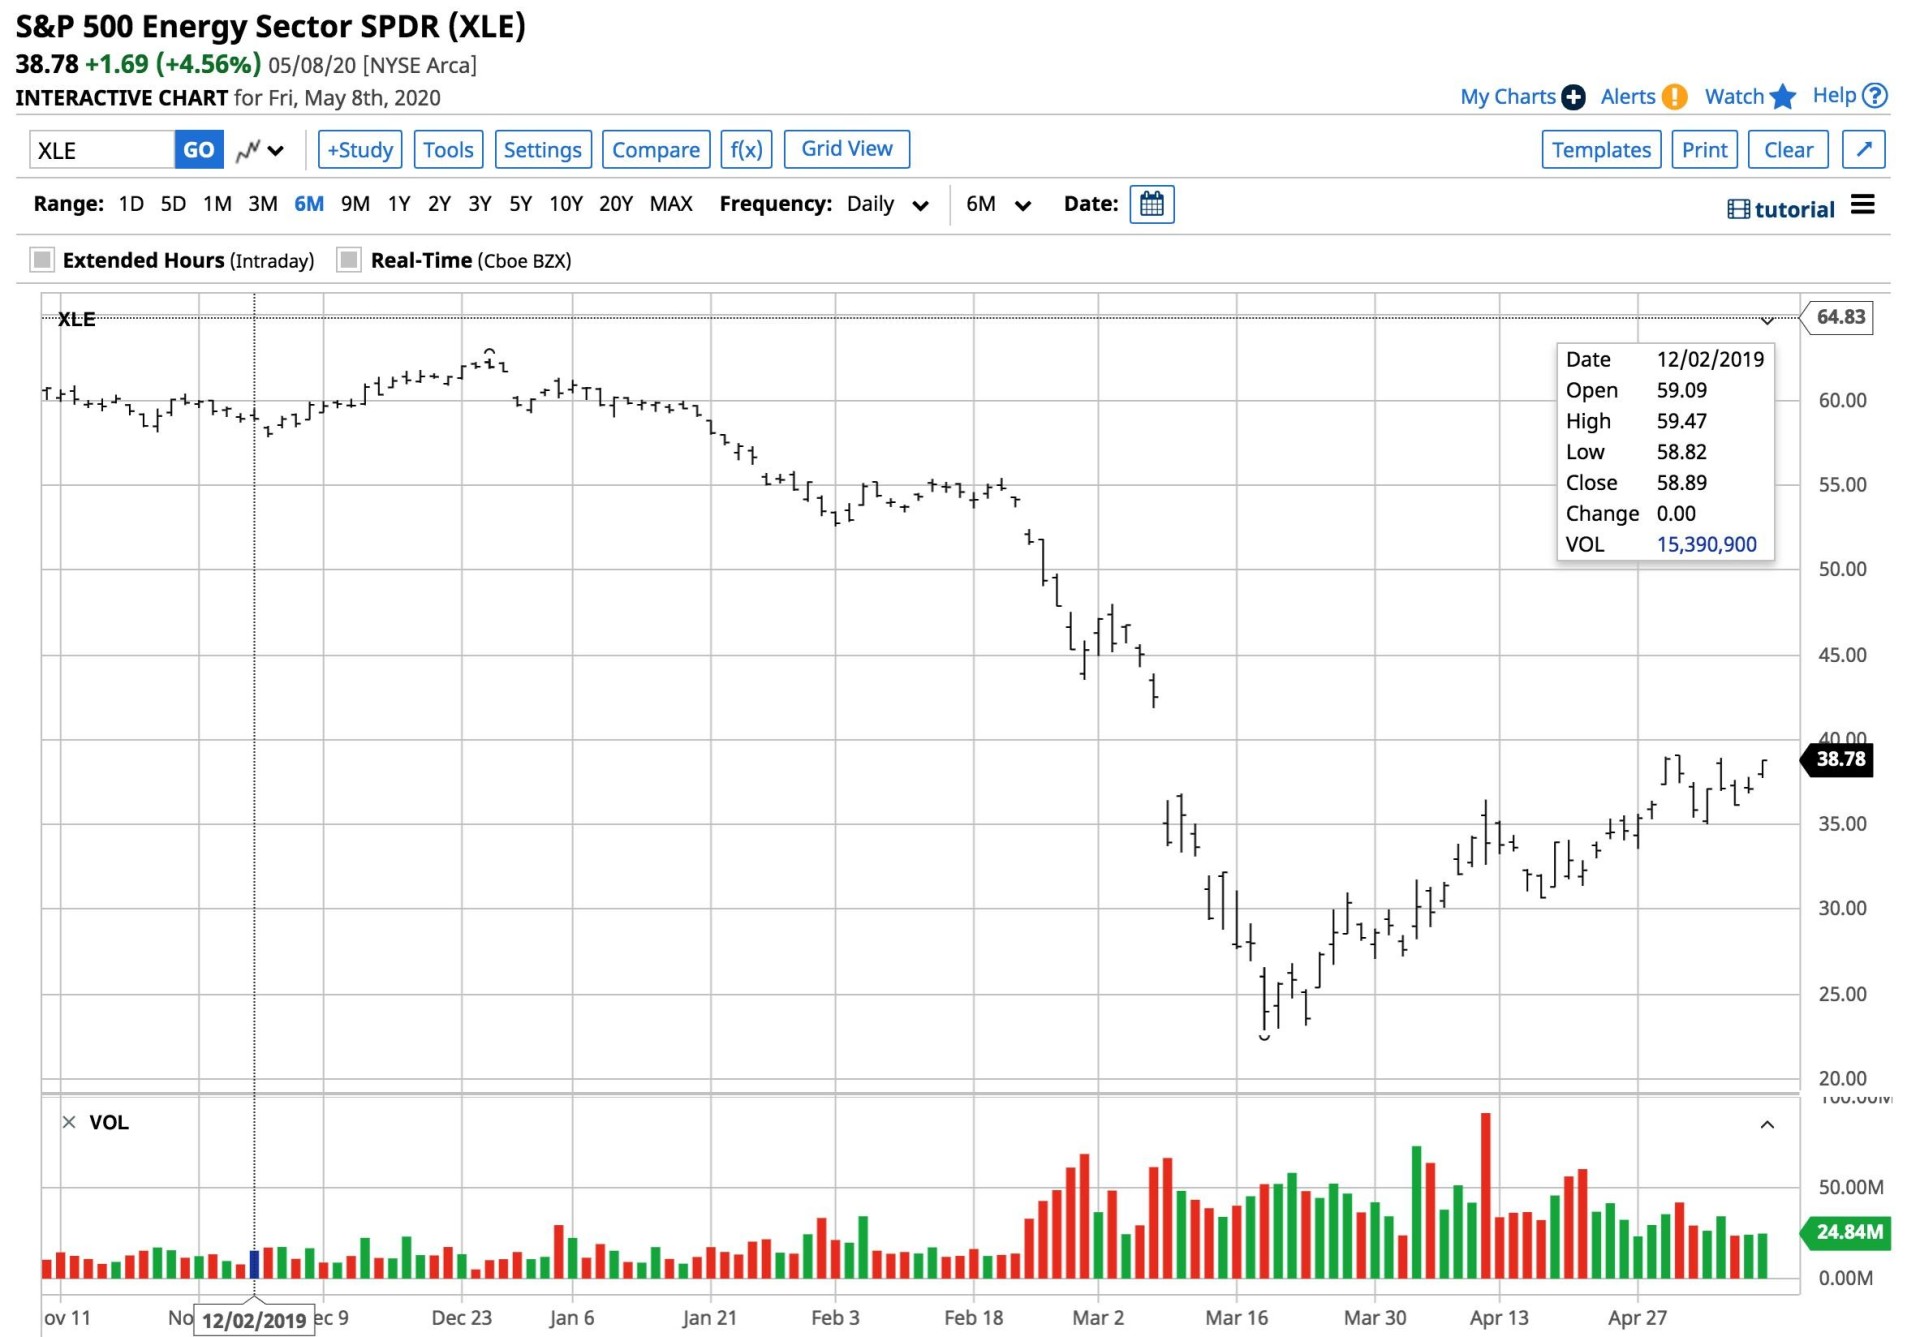
(Source: Barchart)
The XLE rose from a low of $22.88 on March 18 to the $38.78 per share level on Friday, May 8, a rise of 69.5%.
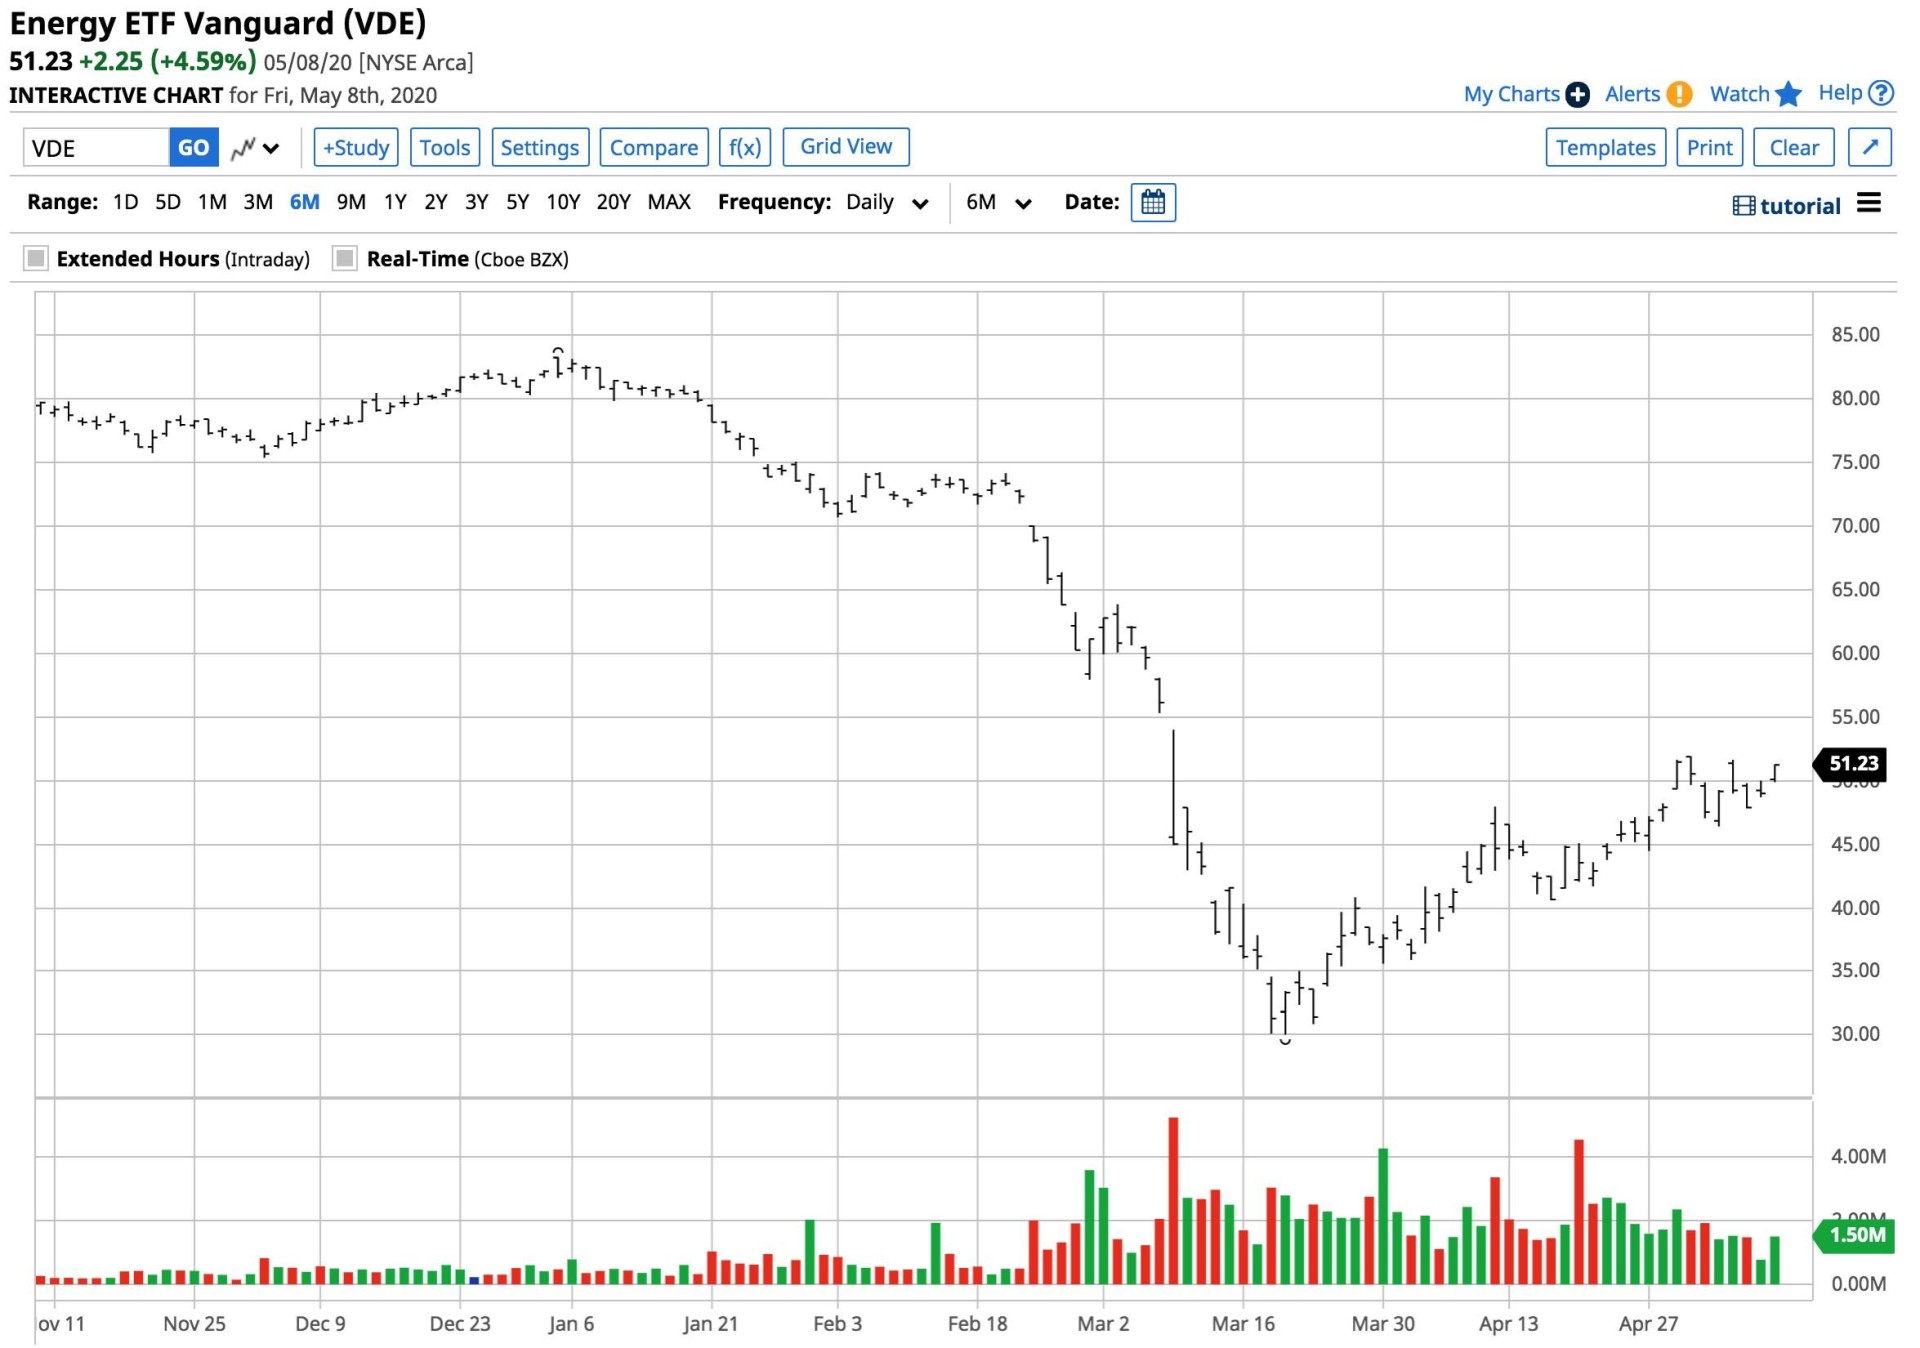
(Source: Barchart)
Over the same period, VDE appreciated from $30.03 to $51.23 per share or 70.6%.
VDE could have more flexibility because of its net asset base
Aside from a lower expense ratio and slightly better performance since the low in mid-March, the lower level of net assets in VDE offers the administrators more flexibility when it comes to adjusting its holdings to reflect market conditions. At the same time, the current environment in the energy sector favors companies with the most robust balance sheets. In the US, XOM and CVX are the companies with the best chance to survive and thrive. VDE has a slightly higher weighting to the two leading companies than XLE when it comes to the overall portfolios.
While the XLE is the product that most analysts look to as a benchmark for the performance of energy-related stocks, the VDE could offer better returns over time. A lower expense ratio, a better track record during a challenging period, and flexibility are reasons to consider VDE over XLE when allocating investment capital to the energy sector.
Want More Great Investing Ideas?
9 “BUY THE DIP” Growth Stocks for 2020
7 “Safe-Haven” Dividend Stocks for Turbulent Times
REVISED 2020 Stock Market Outlook– Discover why there is more downside ahead and the Top 10 picks for the bear market.
XLE shares were trading at $38.45 per share on Monday afternoon, down $0.33 (-0.85%). Year-to-date, XLE has declined -34.53%, versus a -8.49% rise in the benchmark S&P 500 index during the same period.
About the Author: Andrew Hecht

Andy spent nearly 35 years on Wall Street and is a sought-after commodity and futures trader, an options expert and analyst. In addition to working with StockNews, he is a top ranked author on Seeking Alpha. Learn more about Andy’s background, along with links to his most recent articles. More...
More Resources for the Stocks in this Article
| Ticker | POWR Rating | Industry Rank | Rank in Industry |
| XLE | Get Rating | Get Rating | Get Rating |
| VDE | Get Rating | Get Rating | Get Rating |


