Warning: This security is no longer trading.
AAC Holdings, Inc. (AAC): Price and Financial Metrics
AAC Stock Summary
- With a price/sales ratio of 0.04, AAC Holdings Inc has a higher such ratio than merely 1.14% of stocks in our set.
- Over the past twelve months, AAC has reported earnings growth of 2,615.28%, putting it ahead of 99.27% of US stocks in our set.
- AAC Holdings Inc's shareholder yield -- a measure of how much capital is returned to stockholders via dividends and buybacks -- is -407.93%, greater than the shareholder yield of only 1.11% of stocks in our set.
- Stocks that are quantitatively similar to AAC, based on their financial statements, market capitalization, and price volatility, are VTNR, AP, CODI, USAK, and JE.
- Visit AAC's SEC page to see the company's official filings. To visit the company's web site, go to www.americanaddictioncenters.org.
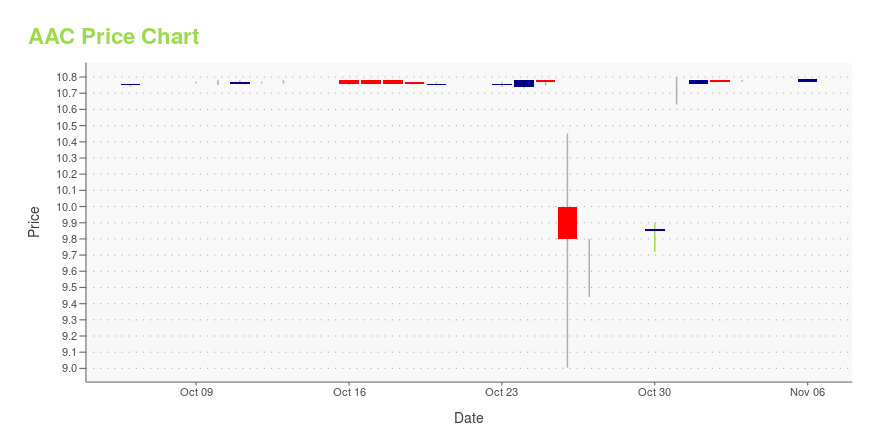
AAC Stock Price Chart Interactive Chart >
AAC Price/Volume Stats
Current price | $0.48 | 52-week high | $6.90 |
Prev. close | $0.47 | 52-week low | $0.32 |
Day low | $0.46 | Volume | 98,700 |
Day high | $0.49 | Avg. volume | 306,774 |
50-day MA | $0.61 | Dividend yield | N/A |
200-day MA | $1.45 | Market Cap | 12.11M |
AAC Price Returns
1-mo | N/A |
3-mo | N/A |
6-mo | N/A |
1-year | N/A |
3-year | -95.10% |
5-year | -97.59% |
YTD | N/A |
2020 | N/A |
2019 | 0.00% |
2018 | -84.44% |
2017 | 24.31% |
2016 | -62.01% |
Get Free Updates
Join thousands of investors who get the latest news, insights and top rated picks from StockNews.com!
Loading social stream, please wait...