Arlington Asset Investment Corp. (AAIC): Price and Financial Metrics
AAIC Price/Volume Stats
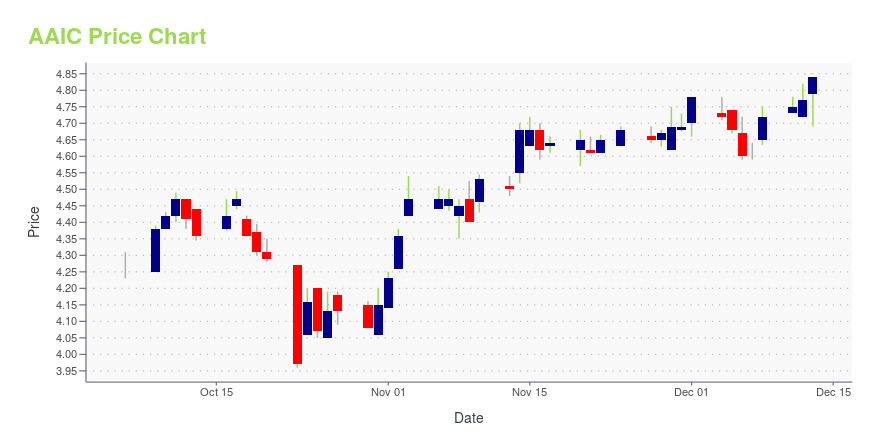
Current price | $4.67 | 52-week high | $4.84 |
Prev. close | $4.65 | 52-week low | $2.53 |
Day low | $4.63 | Volume | 61,000 |
Day high | $4.68 | Avg. volume | 175,501 |
50-day MA | $4.38 | Dividend yield | N/A |
200-day MA | $3.83 | Market Cap | 136.74M |
AAIC Stock Price Chart Interactive Chart >
AAIC Stock Summary
- The ratio of debt to operating expenses for ARLINGTON ASSET INVESTMENT CORP is higher than it is for about 97.67% of US stocks.
- Revenue growth over the past 12 months for ARLINGTON ASSET INVESTMENT CORP comes in at 56.42%, a number that bests 91.4% of the US stocks we're tracking.
- Shareholder yield, a measure of how much is returned to shareholders via dividends and share repurchases, for AAIC comes in at -62.67% -- higher than that of merely 8.91% of stocks in our set.
- Stocks that are quantitatively similar to AAIC, based on their financial statements, market capitalization, and price volatility, are LXP, HAL, MBI, HASI, and LOAN.
- Visit AAIC's SEC page to see the company's official filings. To visit the company's web site, go to www.arlingtonasset.com.
AAIC Valuation Summary
- In comparison to the median Real Estate stock, AAIC's price/sales ratio is 45.24% lower, now standing at 2.3.
- Over the past 243 months, AAIC's price/sales ratio has gone down 7.1.
Below are key valuation metrics over time for AAIC.
Stock | Date | P/S | P/B | P/E | EV/EBIT |
---|---|---|---|---|---|
AAIC | 2023-11-07 | 2.3 | 0.6 | 16.7 | 16.2 |
AAIC | 2023-11-06 | 2.3 | 0.6 | 16.7 | 16.2 |
AAIC | 2023-11-03 | 2.3 | 0.6 | 16.7 | 16.2 |
AAIC | 2023-11-02 | 2.2 | 0.6 | 16.3 | 16.1 |
AAIC | 2023-11-01 | 2.2 | 0.6 | 15.9 | 16.0 |
AAIC | 2023-10-31 | 2.1 | 0.6 | 15.5 | 16.0 |
AAIC Growth Metrics
- Its 2 year cash and equivalents growth rate is now at -95.54%.
- Its 3 year net cashflow from operations growth rate is now at -97.02%.
- The 3 year price growth rate now stands at -52.99%.

The table below shows AAIC's growth in key financial areas (numbers in millions of US dollars).
Date | Revenue | Operating Cash Flow | Net Income to Common Stock |
---|---|---|---|
2022-09-30 | 46.373 | -2.609 | 2.008 |
2022-06-30 | 36.314 | -0.113 | -1.729 |
2022-03-31 | 30.501 | 1.731 | -9.111 |
2021-12-31 | 25.789 | 4.691 | -12.431 |
2021-09-30 | 19.691 | 7.773 | -4.798 |
2021-06-30 | 19.037 | 12.105 | 0.216 |
AAIC's Quality Factors
The “Quality” component of the POWR Ratings focuses on 31 different factors of a companies fundamentals and operational strength. Here are some key insights as we drill into the specifics of these quality attributes.- AAIC has a Quality Grade of C, ranking ahead of 57.07% of graded US stocks.
- AAIC's asset turnover comes in at 0.019 -- ranking 332nd of 444 Trading stocks.
- BDN, EQR, and PCH are the stocks whose asset turnover ratios are most correlated with AAIC.
The table below shows AAIC's key quality metrics over time.
Period | Asset Turnover | Gross Margin | ROIC |
---|---|---|---|
2021-06-30 | 0.019 | 1 | 0.002 |
2021-03-31 | 0.019 | 1 | 0.013 |
2020-12-31 | 0.017 | 1 | -0.029 |
2020-09-30 | 0.012 | 1 | -0.014 |
2020-06-30 | 0.009 | 1 | -0.012 |
2020-03-31 | 0.008 | 1 | -0.014 |
Arlington Asset Investment Corp. (AAIC) Company Bio
Arlington Asset Investment Corp. (NYSE: AI) is a principal investment firm that currently invests primarily in mortgage-related and other assets. The Company is headquartered in the Washington, D.C. metropolitan area.
Latest AAIC News From Around the Web
Below are the latest news stories about ARLINGTON ASSET INVESTMENT CORP that investors may wish to consider to help them evaluate AAIC as an investment opportunity.
Arlington Asset Investment Corp. Declares Third Quarter 2023 Dividends on Preferred StockArlington Asset Investment Corp. (NYSE: AAIC) (the "Company") today announced that its Board of Directors authorized a quarterly dividend of $0.4375 per share of its 7.00% Series B Cumulative Perpetual Redeemable Preferred Stock (NYSE: AAIC PrB) (the "Series B Preferred Stock") and a quarterly dividend of $0.515625 per share of its 8.250% Series C Fixed-to-Floating Cumulative Redeemable Preferred Stock (NYSE: AAIC PrC) (the "Series C Preferred Stock") for the third quarter of 2023. Dividends for |
Arlington Asset Investment Corp. Reports Second Quarter 2023 Financial ResultsArlington Asset Investment Corp. (NYSE: AAIC) (the "Company," "Arlington," "we," "us" or "our") today reported financial results for the quarter ended June 30, 2023. |
Ellington Financial Buys Two Mortgage REITs Within Two MonthsMergers on Wall Street have a way of creating substantial volatility. Usually, the company that makes the acquisition immediately loses a few points, while the company that is acquired skyrockets because of the price premium it receives on the deal. Investors who own the acquiring company hope that the merger will create substantial earnings and revenue that will propel the stock higher down the road. But it doesn’t always work out that way. One well-known example of a deal that went south was t |
3 Monthly Dividend Stocks to Buy in July for a Passive Income StreamThese 3 monthly dividend stocks are ones to watch. |
KKR Agrees to Buy Industrial Machinery Maker Circor for $1.6BKKR agrees to buy Circor for $1.6 billion and take it private. Circor is an industrial machinery maker. |
AAIC Price Returns
1-mo | 14.46% |
3-mo | 1.08% |
6-mo | 12.53% |
1-year | 52.61% |
3-year | 39.82% |
5-year | N/A |
YTD | 59.39% |
2022 | -16.29% |
2021 | -7.41% |
2020 | -32.14% |
2019 | N/A |
2018 | N/A |
Loading social stream, please wait...